The Quiet Toll Booth of the AI Era 🚨
When investors talk about AI chips, the conversation almost always gravitates toward Nvidia and AMD. But there's a less flashy player quietly collecting a royalty on nearly every chip shipped worldwide: Arm Holdings (ARM).
Arm doesn't fabricate chips. It doesn't even design finished silicon. Instead, it licenses fundamental instruction sets and CPU cores to anyone with a foundry contract — and collects a royalty on every unit shipped. Think of it as a toll booth on a highway that keeps widening.
With ARM up +4.04% today trading near $275.61, the market is clearly re-rating this story. But is the valuation justified?

From Smartphones to Data Centers: The New Growth Engine 📌
Arm's historical toll road ran through smartphones. That era produced solid but unspectacular growth — 21% YoY in 2011 and 17% in 2012.
Fast forward to today, and the picture looks entirely different:
- FY growth rates of 23% and 24% over the last two fiscal years
- Gross margin of 93.88% — a software-like profile for a semiconductor IP company
- Market cap of $294B on a business that essentially sells blueprints
The data center is now the second pillar. Nvidia's Vera CPU, Amazon's Graviton, Microsoft's Cobalt, and Google's Axion are all built on Arm architecture. Every AI cluster needs general-purpose compute to feed accelerators — and a growing share of that sits on Arm designs.
Climbing the Value Chain
The Armv9 architecture commands higher royalty rates than its predecessor. Compute subsystems — pre-validated bundles of cores and interconnect — let customers skip years of design work while paying Arm substantially more per chip. The result: richer royalties per chip AND accelerating unit volumes.
The market is clearly split on whether Arm's premium valuation is justified. Here's how the bull and bear cases stack up:

The Valuation Question: 55x Sales, 188x FCF 💸
Let's be direct — Arm is not cheap:
| Metric | Value |
|---|---|
| Trailing P/S | 55x |
| Trailing P/FCF | 188x |
| 52-Week Range | $100.02 – $452.70 |
| Today's Range | $261.65 – $275.78 |
| Volume vs Avg | 7M vs 5.4M |
For context, ARM has outperformed Nvidia over the last month, year, and three years (as of mid-September). That's remarkable given Nvidia's dominance in AI accelerators.
Technical Perspective
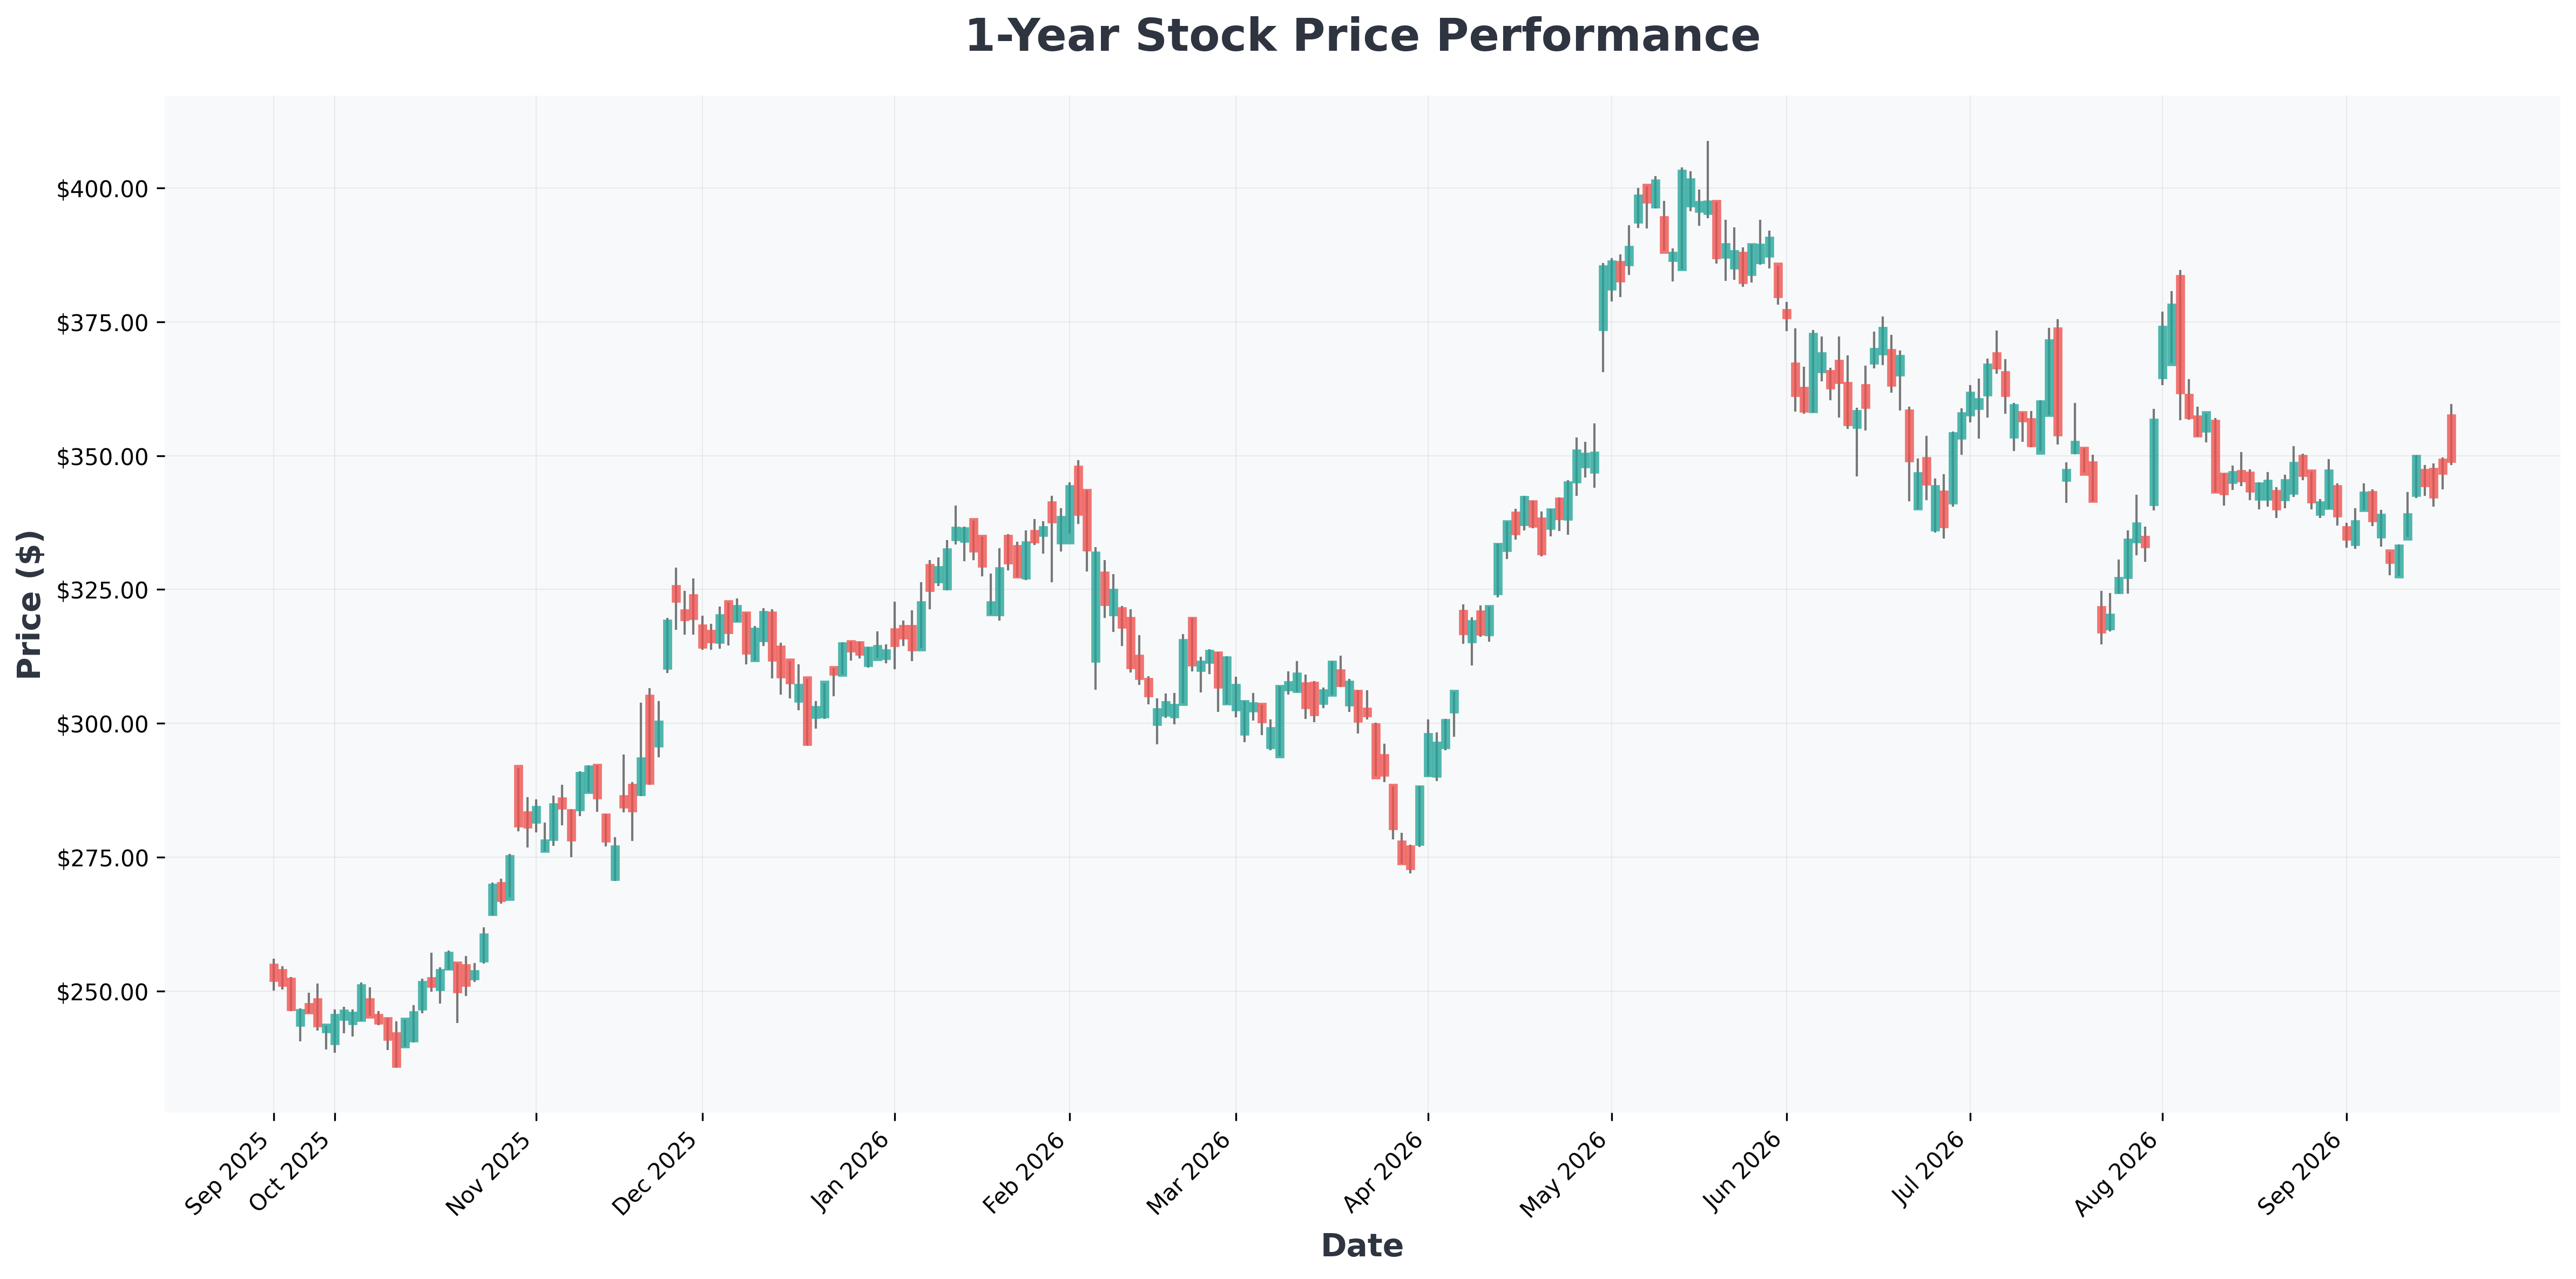
From a technical standpoint, ARM has been consolidating between the $260 support zone and the $280 resistance band. A sustained break above $280 with volume could open a path back toward the $300–$320 region, while losing $260 would likely invite a retest of the $240 area. Historically, high-multiple semiconductor IP names tend to see sharp mean-reversion moves when momentum fades — a pattern worth backtesting against ARM's own 2023 drawdown.
📊 In-Depth Fundamental Analysis
| Company | Share Price | P/E Ratio | P/B Ratio | ROE | Operating Margin (OPM) | Revenue Growth |
|---|---|---|---|---|---|---|
| AMD (Advanced) | $560 | 142.81 | 13.59 | 10.20% | 17.25% | 50.10% |
| AMZN (Amazon.com,) | $254 | 20.41 | 4.96 | 30.56% | 13.69% | 19.60% |
| ARM (Arm) | $276 | 278.39 | 34.11 | 13.35% | 7.60% | 22.40% |
| GOOG (Alphabet) | $344 | 17.27 | 6.77 | 48.68% | 34.03% | 24.20% |
| GOOGL (Alphabet) | $350 | 17.55 | 6.87 | 48.68% | 34.03% | 24.20% |
| MSFT (Microsoft) | $494 | 27.48 | 8.29 | 34.04% | 45.11% | 17.70% |
| NVDA (NVIDIA) | $222 | 28.10 | 23.44 | 117.21% | 66.24% | 105.90% |

Scenario Analysis: Where Does ARM Go From Here? 🎯
🐂 Best-Case Scenario
- Data center royalty mix continues rising
- Armv9 and compute subsystems drive ASP expansion
- AI capex cycle extends through 2027
- Potential outcome: Multiple expansion holds; stock revisits $350+
🐻 Worst-Case Scenario
- AI capex digestion phase hits hyperscaler orders
- RISC-V open-source architecture gains traction
- Valuation compression from 55x to 30x sales
- Potential outcome: Sharp drawdown toward $180–$200
The Bottom Line
Arm is a high-quality compounder with a software-like margin profile, but the stock is priced for near-perfection. Investors with a long time horizon may find the toll-booth model attractive; those chasing momentum should be aware that 55x sales leaves zero room for execution errors.
As always, position sizing and risk management matter more than the narrative. 📌