Banks Enter Earnings Season Under a Cloud of Downgrades 📉
Next week, big banks kick off Q2 earnings season. But instead of bullish optimism, a wave of analyst downgrades has hit the sector. Oppenheimer recently downgraded Goldman Sachs (GS) and Morgan Stanley (MS) from 'Perform' to 'Underperform', and lowered Citigroup (C) and Bank of America (BAC) from 'Outperform' to 'Perform'.
The message is clear: current valuations are flush, and the market may be pricing in perfection that won't materialize. Here's the full bear case.
Why Oppenheimer Says 'Take the Money and Run' 🏃💸
According to Oppenheimer analysts, the risk/reward for large investment banks has become unfavorable. Their note states: "While the cycle may well go on for another 12-18 months or more, we'd rather not wait around for the warning signs to appear."
Key concerns include:
- IPO Dependency: Investment banks like GS and MS have surged on hopes of a wave of IPOs (SpaceX, OpenAI, Anthropic). But higher bond yields and geopolitical tensions (Iran) could delay these catalysts.
- Valuation Stretch: Both stocks have outperformed the broader banking group this year, leaving little room for upside surprises.
- Credit Risk: If the Fed raises rates again, credit conditions could tighten, hurting both consumers and businesses.
This downgrade has split the Street. Here's how the bulls and bears are framing the debate:

The Data Behind the Downgrade 📊
| Metric | Goldman Sachs (GS) | Morgan Stanley (MS) |
|---|---|---|
| YTD Performance | +14% | +11% |
| Q1 2026 IB Revenue Growth (YoY) | +48% | +36% |
| Current P/E vs 5-Year Avg | Above 90th Percentile | Above 85th Percentile |
| Analyst Rating | Underperform (New) | Underperform (New) |
Data source: YCharts, Oppenheimer Research.
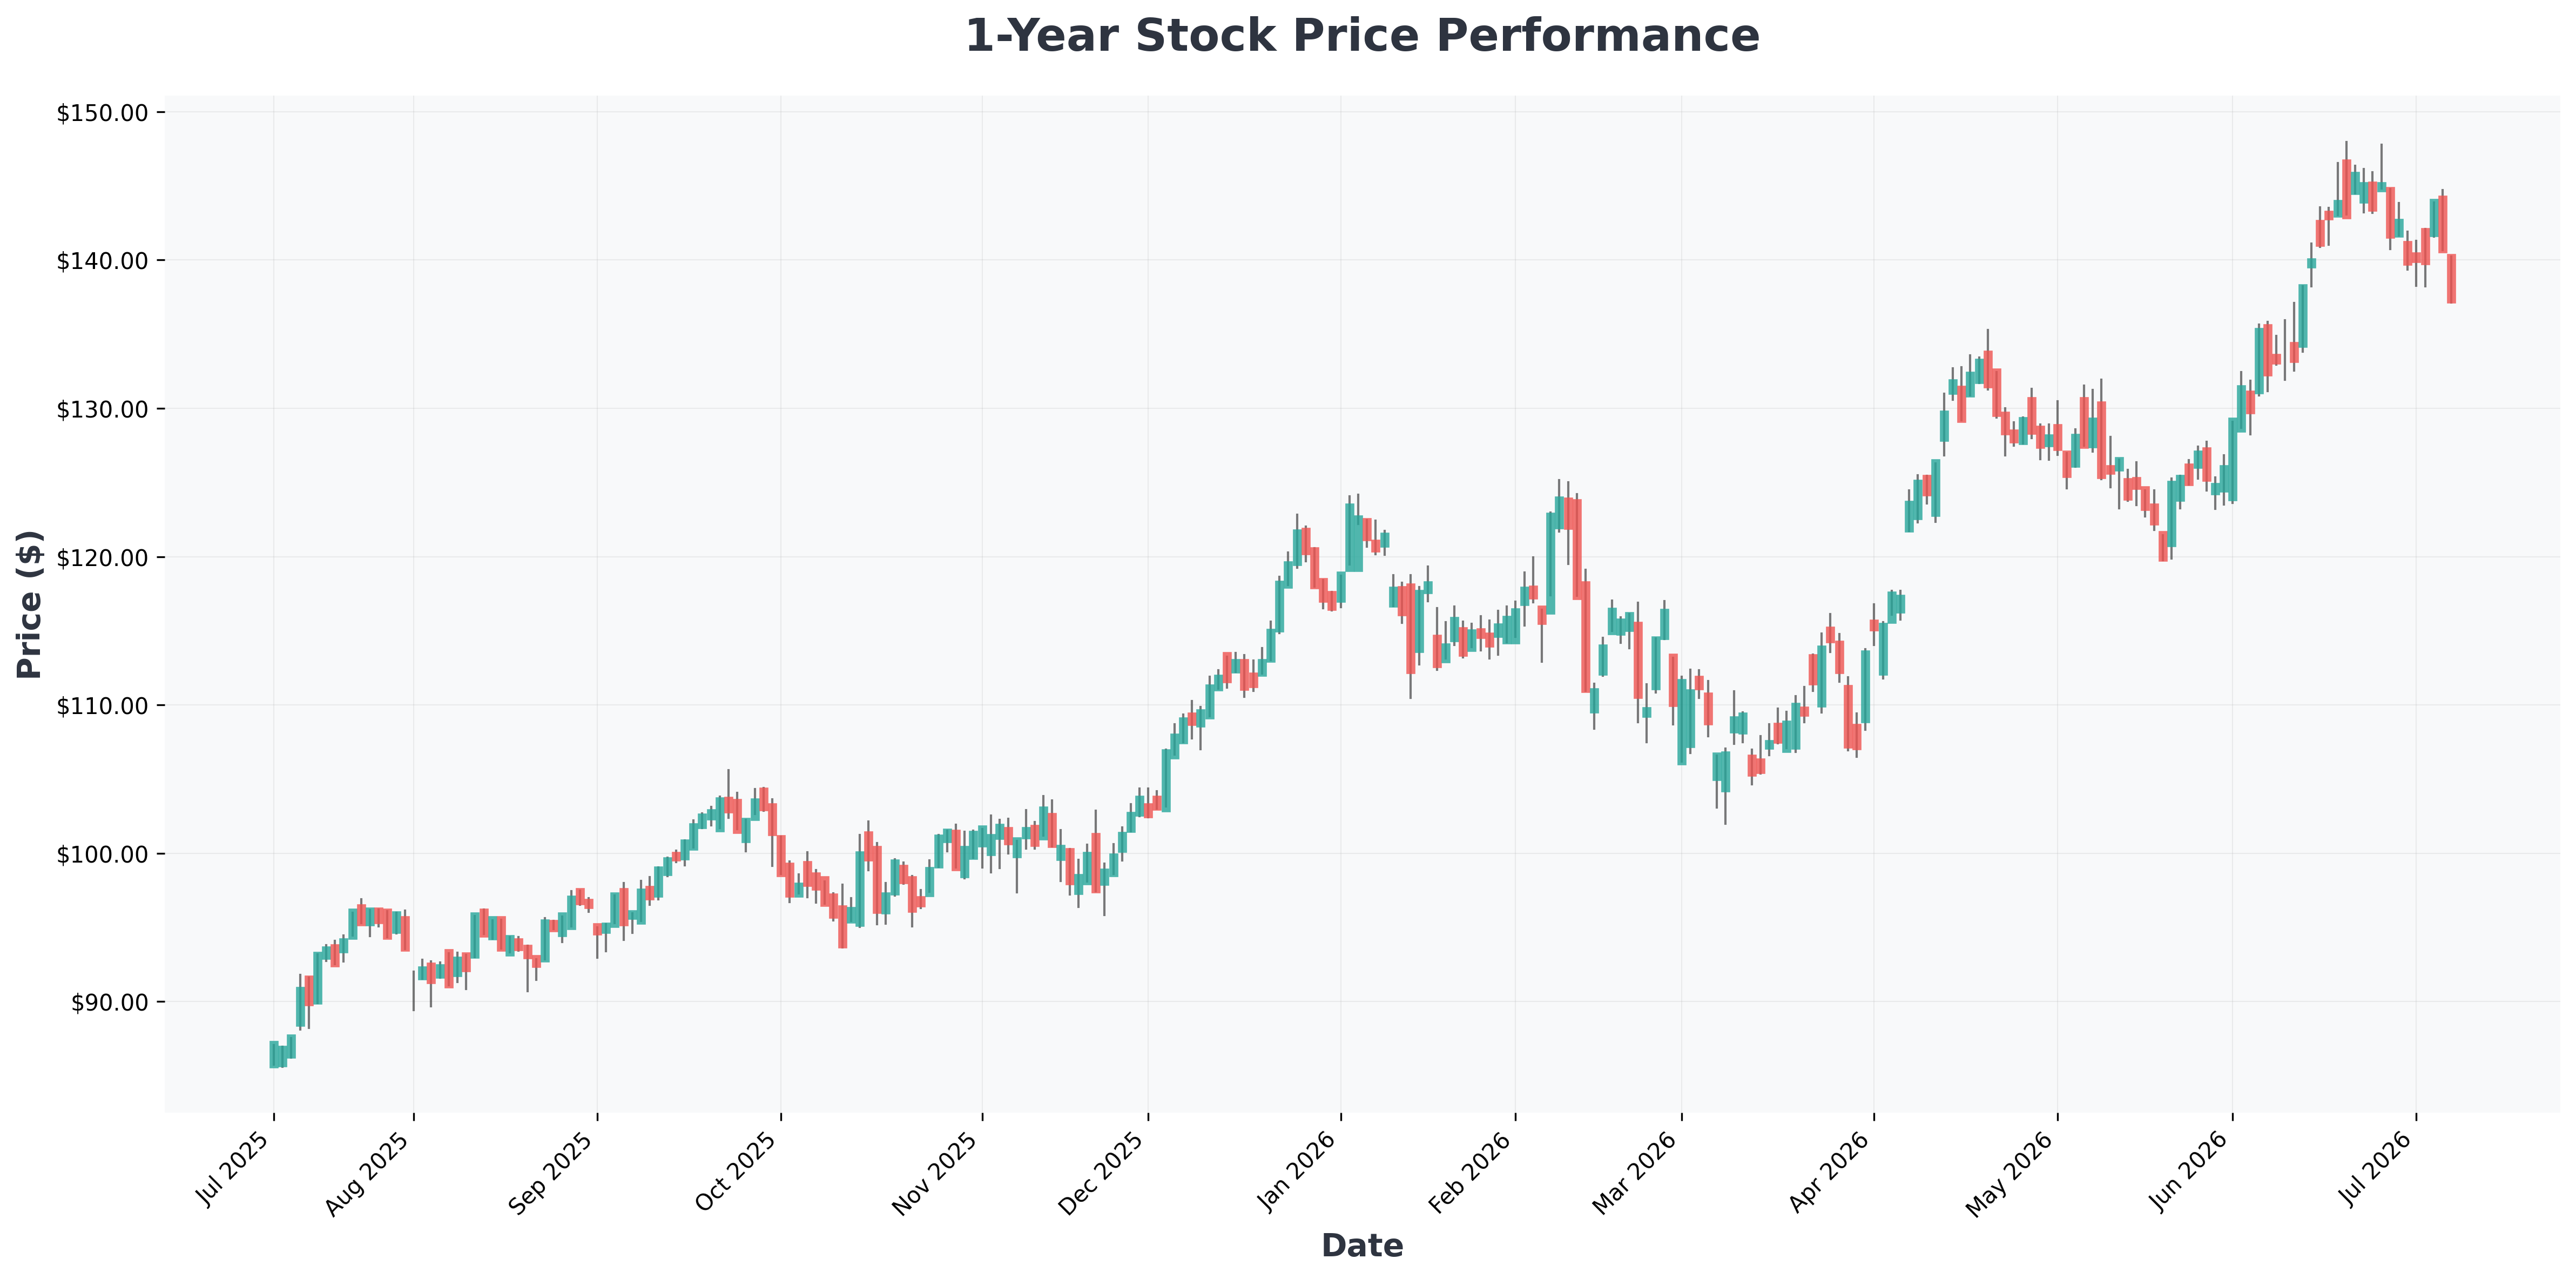
⚠️ Technical Insight: Both GS and MS are trading near their upper Bollinger Bands on the weekly chart, suggesting overbought conditions. A pullback to the 50-day moving average (around 5-7% downside) would not be surprising if earnings disappoint.
📊 In-Depth Fundamental Analysis
| Company | Share Price | P/E Ratio | P/B Ratio | ROE | Operating Margin (OPM) | Revenue Growth |
|---|---|---|---|---|---|---|
| ARES (Ares) | $122 | 56.06 | 10.69 | 14.18% | 18.43% | 28.30% |
| BAC (Bank) | $59 | 14.70 | 1.53 | 10.64% | 35.96% | 8.10% |
| C (Citigroup,) | $140 | 17.25 | 1.24 | 7.65% | 34.08% | 15.90% |
| GS (Goldman) | $1,056 | 19.28 | 2.96 | 14.55% | 38.60% | 14.50% |
| KKR (KKR) | $96 | 32.74 | 3.06 | 7.66% | 11.01% | -6.60% |
| MS (Morgan) | $222 | 20.14 | 3.36 | 16.39% | 40.62% | 16.30% |
| PNC (PNC) | $251 | 14.58 | 1.75 | 12.10% | 36.73% | 13.80% |
| USB (U.S.) | $62 | 12.98 | 1.65 | 12.35% | 37.84% | 4.60% |

Best vs. Worst Case Scenarios for Bank Stocks 🎯
| Scenario | Conditions | Implication for GS/MS |
|---|---|---|
| 🟢 Best Case | IPO wave resumes, Fed pauses, credit stable | Short-term pop, but valuation remains stretched. Upside limited to 3-5%. |
| 🟡 Base Case | Mixed earnings, IPO delays continue | Gradual re-rating lower. Downside of 5-10% over 3 months. |
| 🔴 Worst Case | Fed hikes, credit losses rise, IPO freeze | Sharp sell-off. Downside of 15-20% as growth premium evaporates. |
The Playbook: Oppenheimer suggests rotating into super-regionals (USB, PNC) and alternative asset managers (ARES, KKR) which offer better value and expansion potential.