📊 Earnings Growth: The Headline Looks Great
This earnings season has delivered some impressive top-line numbers. Companies across the S&P 500 are beating estimates, and the market is celebrating. But as the saying goes, "Revenue is vanity, profit is sanity." The real story is hiding in the fine print. 📌
Investors should be asking a critical question: At what cost did this growth come?

🔍 The Real Cost of Growth: Margins & Debt
While revenues are up, we are seeing a worrying trend in operating margins. Companies are spending more to generate each dollar of sales. This is due to persistent inflation in labor costs, higher interest payments on corporate debt, and supply chain inefficiencies.
- Rising SG&A: Selling, General & Administrative expenses are climbing faster than revenue for many firms. 🚨
- Debt Burden: With interest rates remaining elevated, refinancing older low-rate debt is becoming a painful drag on net income.
This creates a fragile situation. If revenue growth slows even slightly, profits could collapse.
The market is split on this earnings season. Here’s how the bulls and bears see it:
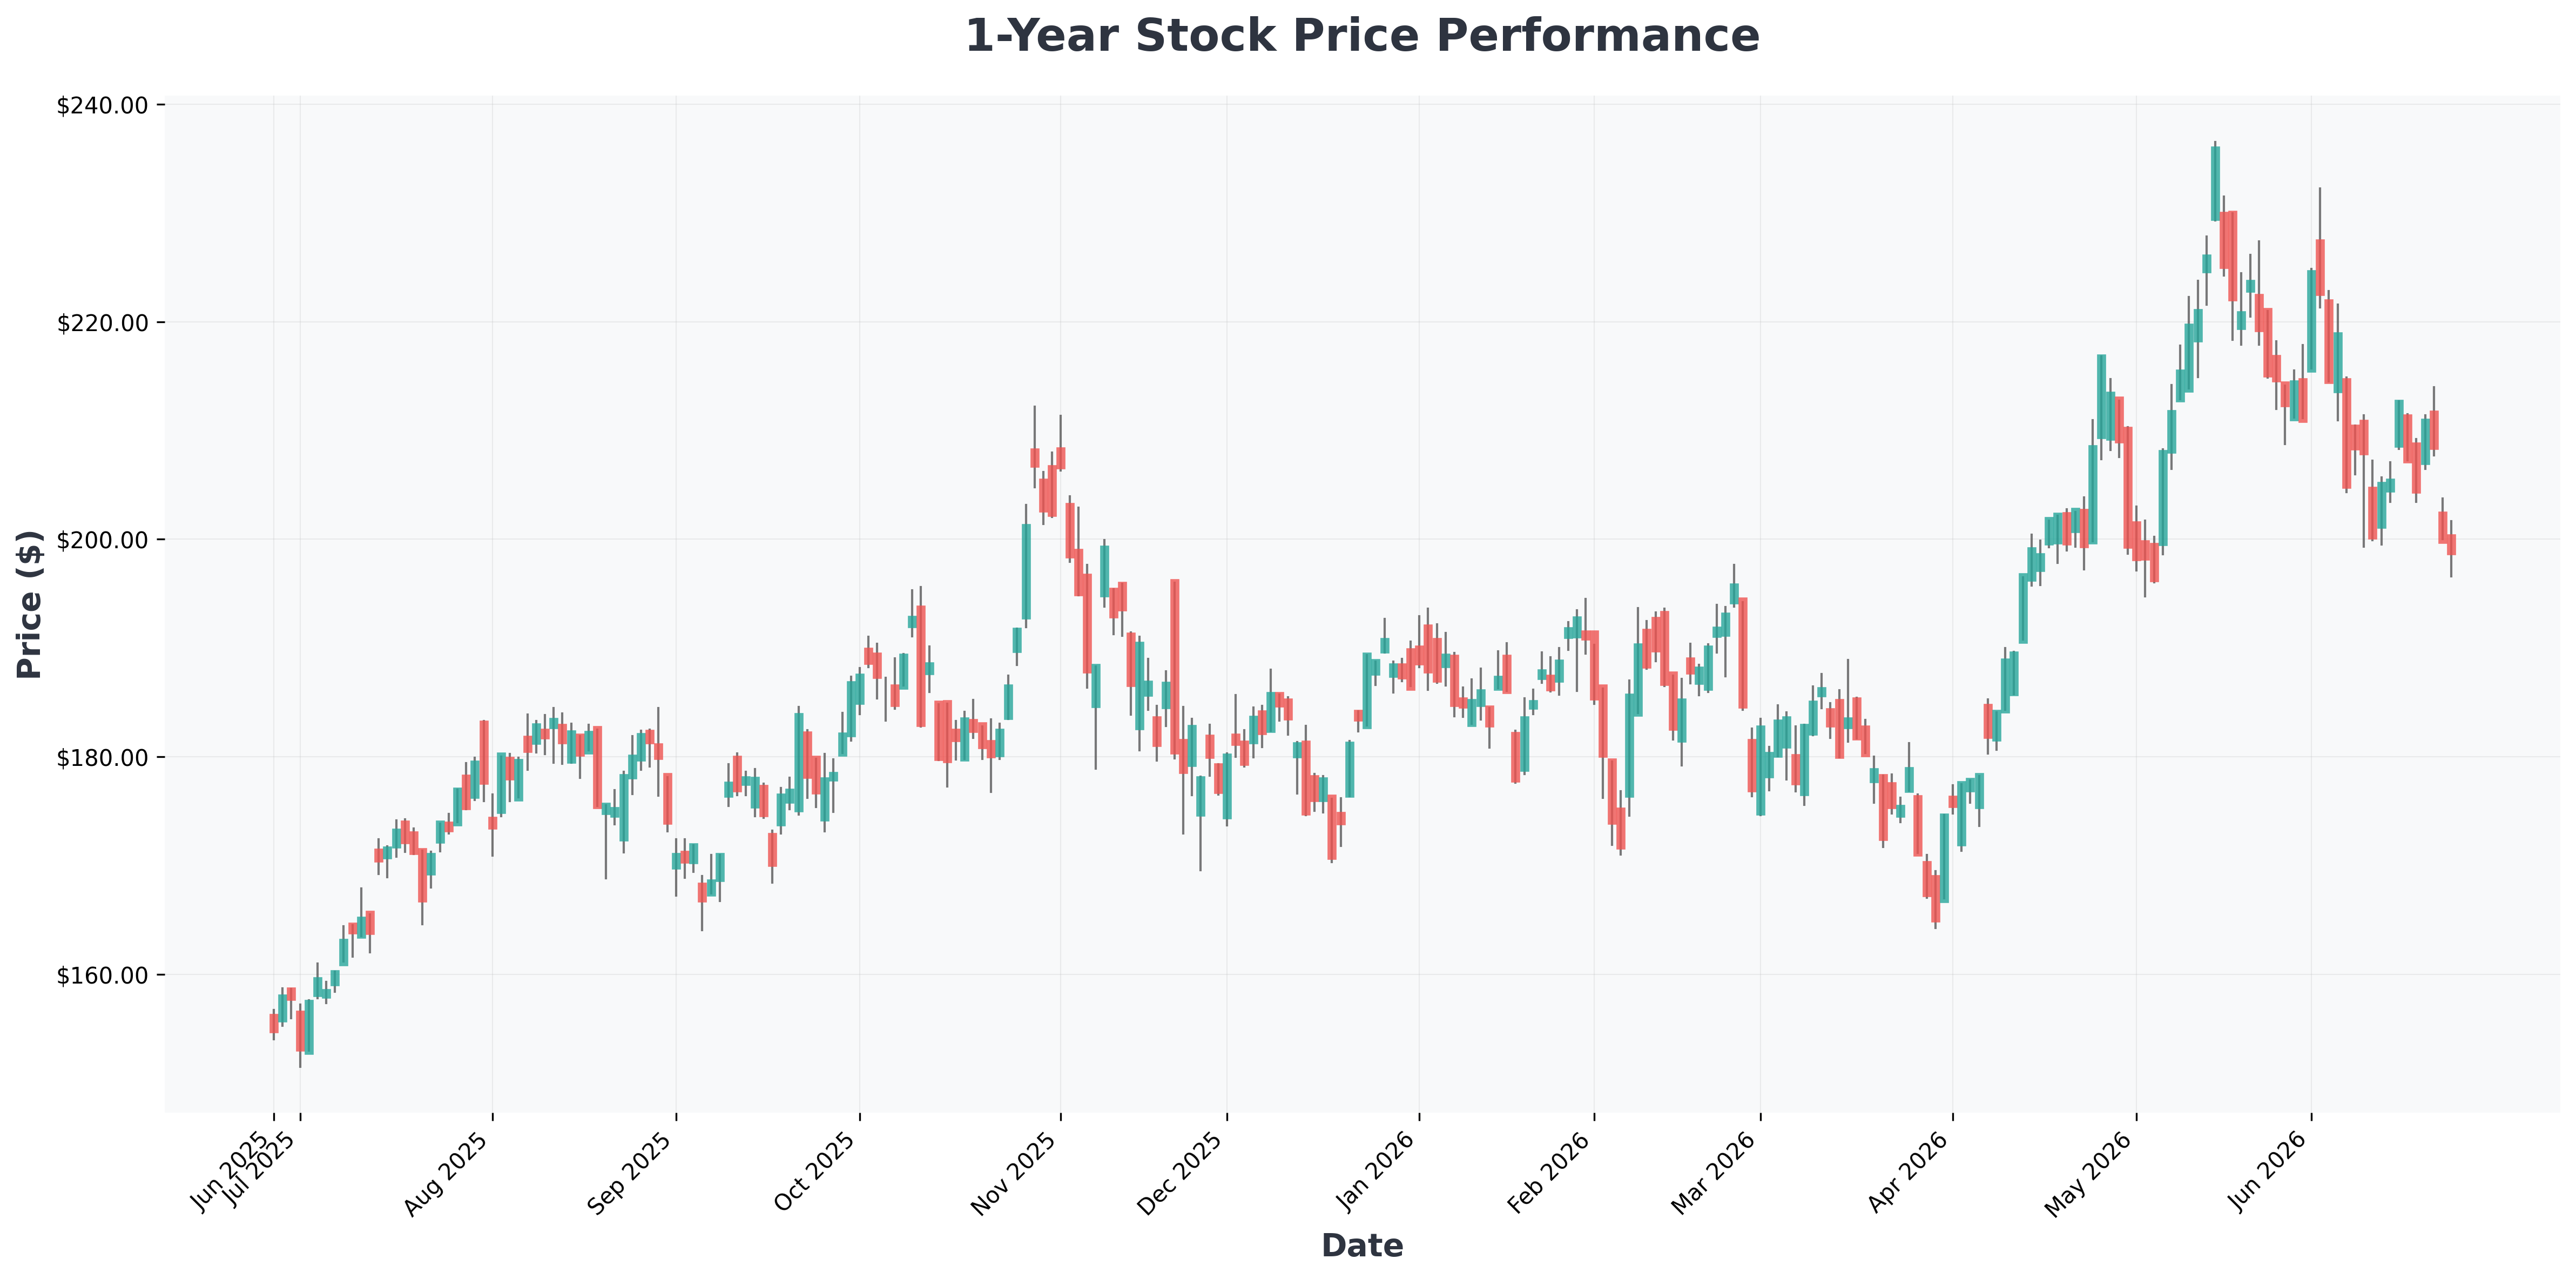

📉 Scenario Analysis: Best vs. Worst Case
| Scenario | Key Driver | Potential Outcome | Probability |
|---|---|---|---|
| Bull Case (Soft Landing) | The Fed cuts rates, easing debt pressure and boosting consumer spending. | Margins stabilize, earnings growth continues, S&P 500 hits new highs. | 30% |
| Base Case (Sticky Inflation) | Costs remain high, but companies maintain pricing power. | Earnings growth slows to low single digits. Market remains range-bound. | 45% |
| Bear Case (Earnings Recession) | Consumer demand falters, pricing power breaks, and margins compress sharply. | A wave of profit warnings hits. S&P 500 corrects 15-20%. | 25% |
Note: Historical data suggests that periods of margin compression are often followed by significant market drawdowns.
📊 In-Depth Fundamental Analysis
| Company | Share Price | P/E Ratio | P/B Ratio | ROE | Operating Margin (OPM) | Revenue Growth |
|---|---|---|---|---|---|---|
| AMZN (Amazon.com,) | $227 | 30.68 | 5.52 | 24.29% | 13.14% | 16.60% |
| GOOG (Alphabet) | $342 | 26.10 | 8.66 | 38.88% | 36.12% | 21.80% |
| GOOGL (Alphabet) | $344 | 26.20 | 8.70 | 38.88% | 36.12% | 21.80% |
| META (Meta) | $543 | 19.75 | 5.65 | 32.93% | 40.62% | 33.10% |
| MSFT (Microsoft) | $353 | 21.04 | 6.33 | 34.01% | 46.33% | 18.30% |
| MU (Micron) | $1,214 | 27.43 | 18.89 | 39.82% | 67.62% | 196.30% |
| NVDA (NVIDIA) | $196 | 29.98 | 24.26 | 114.29% | 65.60% | 85.20% |
| ORCL (Oracle) | $152 | 26.15 | 13.07 | 53.38% | 36.20% | 20.60% |

💎 Conclusion: Quality Over Quantity
This earnings season is a classic trap for momentum chasers. The headline numbers are good, but the underlying quality is deteriorating. Investors should pivot towards companies with strong balance sheets, low debt, and proven pricing power.
Your move: Don't just buy the hype. Look at the cash flow statement. If growth is being funded by debt, it is a house of cards. 🃏