The Roundhill Magnificent Seven ETF (MAGS) has been the poster child for megacap tech concentration since its launch in April 2023. After delivering eye-popping annualized returns of 55% in 2023 and 62% in 2024, the fund has hit a wall in 2025, managing just a 2% gain year-to-date while the Nasdaq Composite and S&P 500 have each climbed 12%. 📉
But here's the paradox: despite this underperformance, the ETF is trading near its 52-week high at $68.60, and institutional money continues to flow in. Let's unpack the disconnect and whether this is a genuine opportunity or a value trap.

Why MAGS Is Underperforming – And Why It Matters
The Concentration Conundrum
The MAGS ETF's weakness is a textbook case of concentration risk. When you pack seven megacap growth stocks into a single fund, you inherit their collective vulnerabilities. This year, the "Magnificent Seven" have been a tale of two camps: 🐻
- Tesla (TSLA) and Meta (META) are dragging the fund down with double-digit negative returns.
- Apple (AAPL), Amazon (AMZN), and Nvidia (NVDA) are beating the benchmarks but only marginally.
- Alphabet (GOOG) and Microsoft (MSFT) are positive but stuck in single-digit territory.
The Valuation Story Is More Nuanced
Here's where it gets interesting. The fund's average P/E ratio sits at 29, which looks reasonable compared to the Nasdaq-100's 34. But that average is heavily skewed by Tesla's insane 323 P/E ratio. Strip out Tesla, and five of the remaining six stocks – Amazon, Microsoft, Nvidia, Alphabet, and Meta – are trading at or below their historical average valuations. 🎯
This creates a fascinating dynamic: the ETF's headline valuation looks fair, but the underlying composition is a mix of overpriced hype and genuine value.
The market is genuinely split on whether MAGS is a buy here. Let's hear both sides of the argument.

The Bull vs. Bear Debate: Is This a Buy or a Trap?
This is where the market is genuinely divided, and investors are taking sides. The core question isn't whether MAGS is a good fund – it's whether the current entry point justifies the concentration risk.
📊 In-Depth Fundamental Analysis
| Company | Share Price | P/E Ratio | P/B Ratio | ROE | Operating Margin (OPM) | Revenue Growth |
|---|---|---|---|---|---|---|
| AAPL (Apple) | $315 | 36.12 | 42.74 | 148.75% | 32.62% | 16.40% |
| AMZN (Amazon.com,) | $256 | 20.60 | 5.01 | 30.56% | 13.69% | 19.60% |
| GOOG (Alphabet) | $338 | 16.94 | 6.64 | 48.68% | 34.03% | 24.20% |
| GOOGL (Alphabet) | $341 | 17.08 | 6.69 | 48.68% | 34.03% | 24.20% |
| META (Meta) | $571 | 21.50 | 5.57 | 29.85% | 34.83% | 28.00% |
| MSFT (Microsoft) | $505 | 28.11 | 8.48 | 34.04% | 45.11% | 17.70% |
| NVDA (NVIDIA) | $228 | 34.97 | 28.25 | 114.29% | 65.60% | 85.20% |
| TSLA (Tesla,) | $355 | 331.60 | 16.13 | 4.67% | 1.41% | 25.50% |

Scenario Analysis: What Could Happen Next?
📈 Bull Case (Probability: 45%)
| Scenario | Projected Return (12-month) | Key Drivers |
|---|---|---|
| Broad AI Rally Continues | +30% to +40% | Nvidia, Microsoft, and Alphabet lead on AI monetization; Tesla recovers from its slump |
| Multiple Expansion | +20% to +25% | Fed cuts rates, risk appetite returns, and megacap growth gets re-rated |
📉 Bear Case (Probability: 30%)
| Scenario | Projected Return (12-month) | Key Drivers |
|---|---|---|
| AI Bubble Deflation | -15% to -25% | Nvidia's guidance disappoints, dragging down the entire complex |
| Regulatory Crackdown | -10% to -20% | Antitrust actions against Alphabet and Meta intensify, hitting valuations |
⚖️ Base Case (Probability: 25%)
| Scenario | Projected Return (12-month) | Key Drivers |
|---|---|---|
| Grind Higher | +5% to +10% | The fund continues to lag the broader market but avoids a major drawdown |
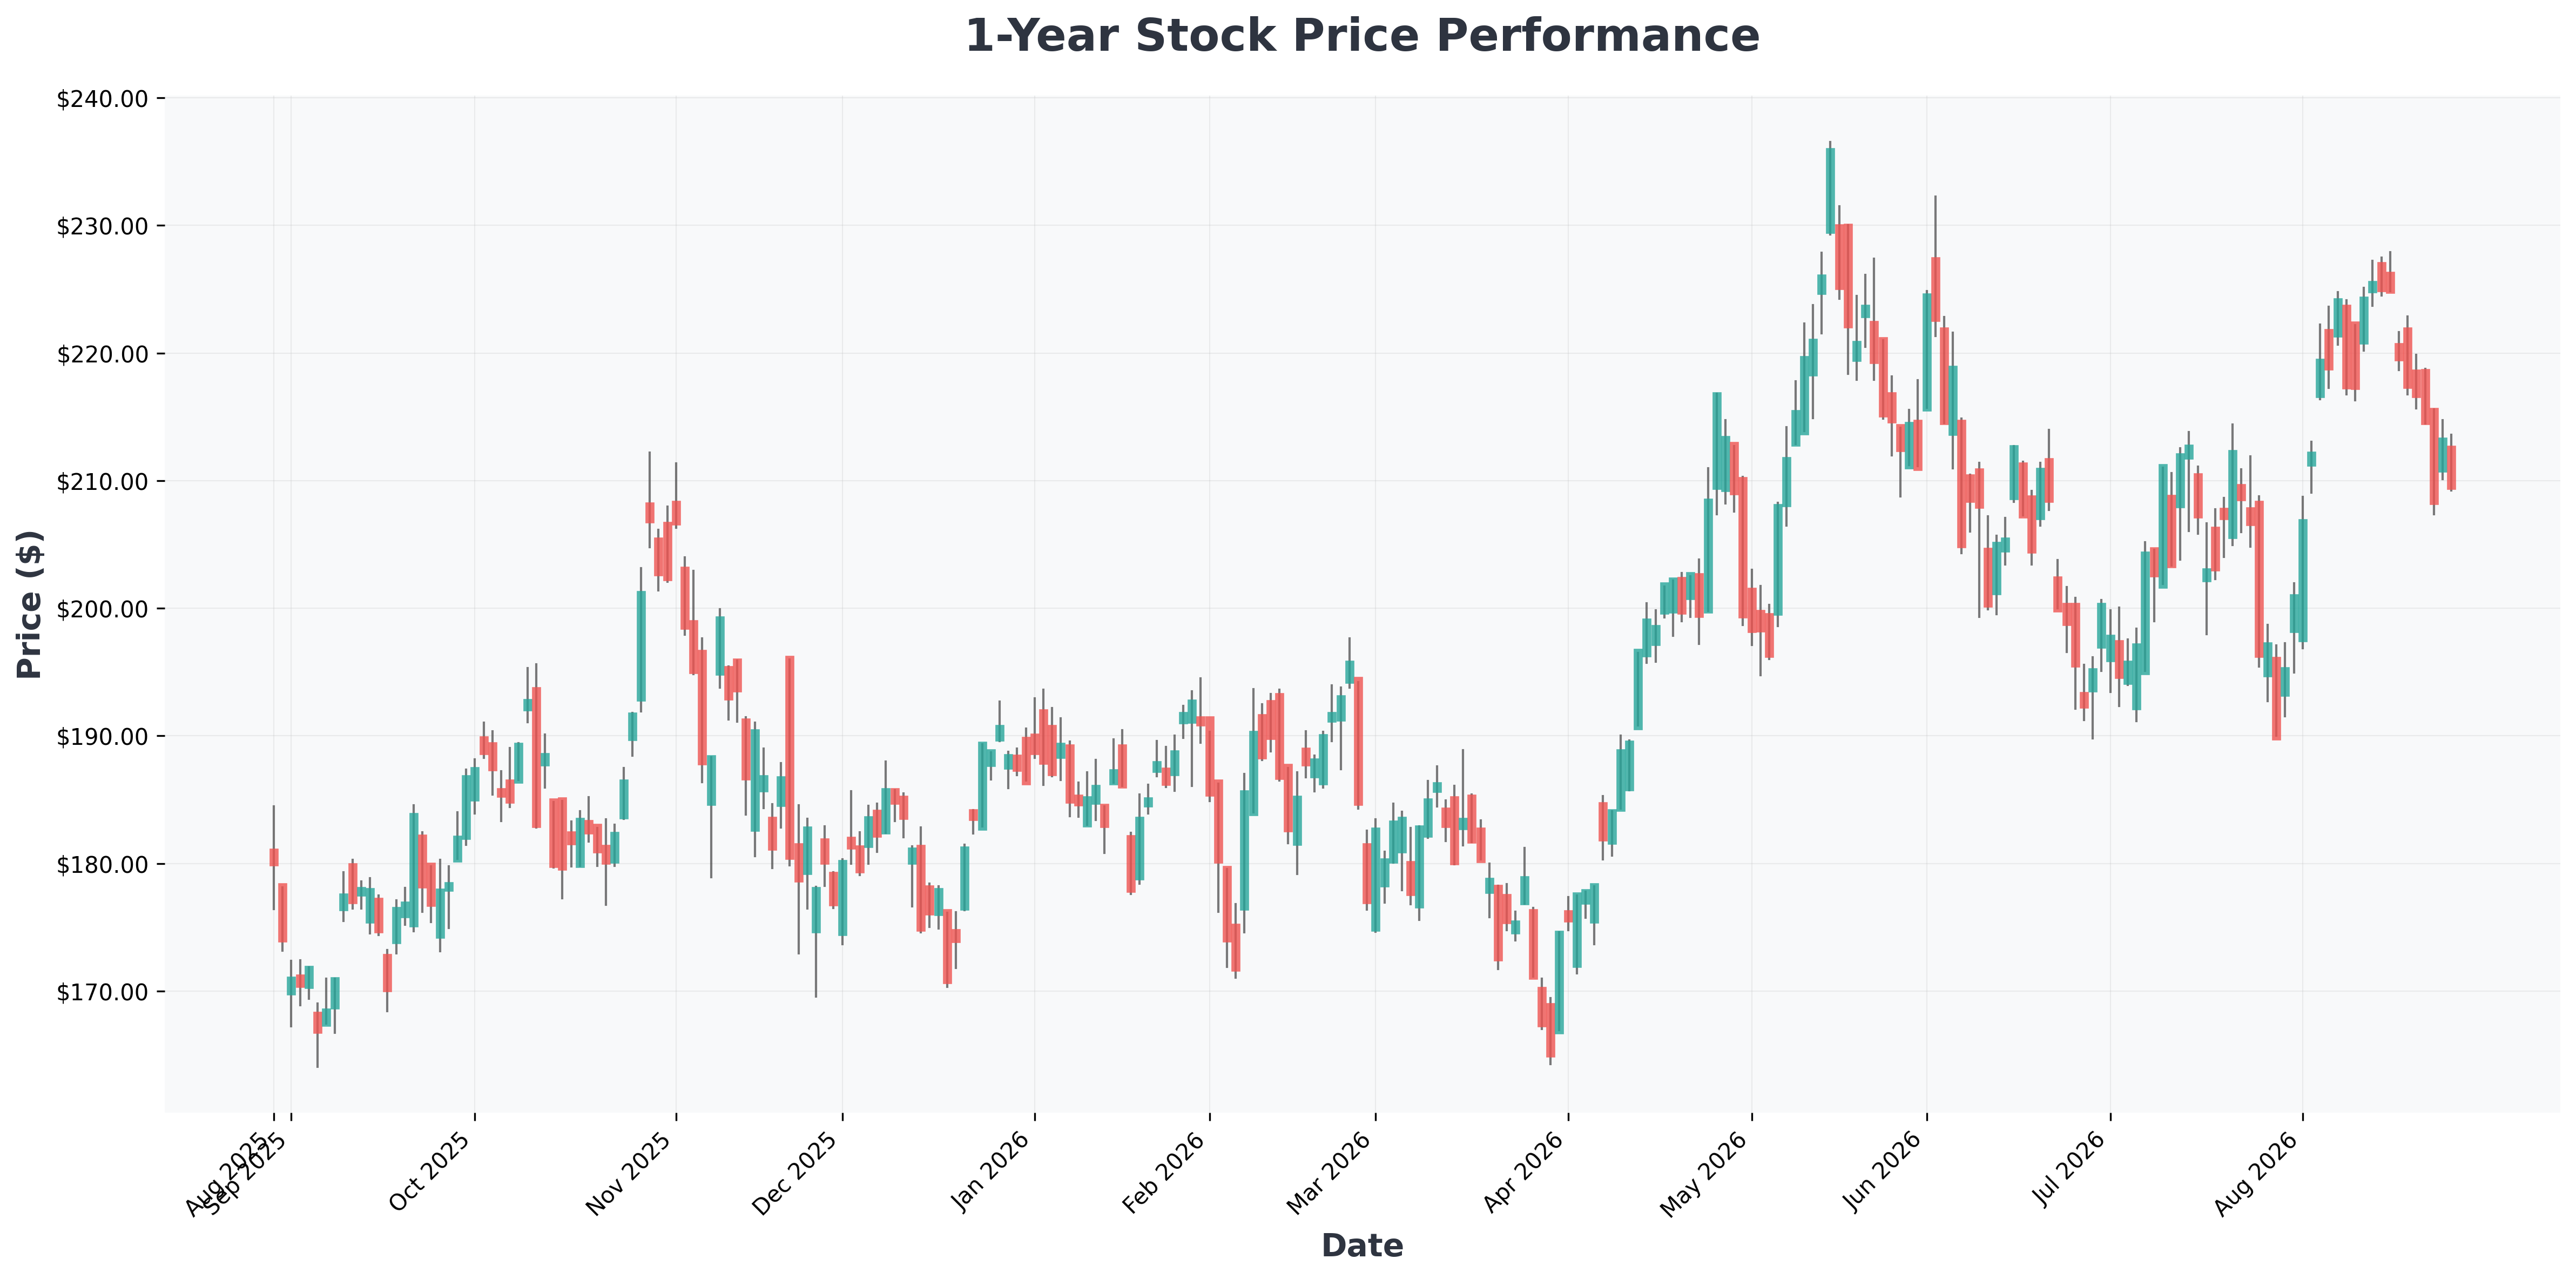
Technical Note: Looking at the weekly chart, MAGS has established strong support around $62–$64, a level that held during the August correction. Resistance sits at $71, the 52-week high. A breakout above $71 on above-average volume would signal the resumption of the uptrend, while a close below $62 would invalidate the bullish thesis. Historically, concentrated ETFs like this tend to see sharp mean-reversion moves after extended periods of underperformance – a pattern we saw with the QQQ in 2016 before its massive run.