📌 The S&P 500 has a new king.
For years, Apple sat comfortably on top. But as of June 30, Nvidia (NVDA) has officially taken the crown, commanding a 7.50% weight in the Vanguard S&P 500 ETF (VOO) compared to Apple's 6.58%. This isn't just a symbolic change; it's a structural shift in what it means to own "the whole market."
If you invest $10,000 in VOO, roughly $750 is now riding on Nvidia's AI success. Here’s a breakdown of the new order and why this concentration matters more than ever.

The AI-Fueled Shift at the Top 🚀
The switch happened quickly. Nvidia first surpassed Apple's market value in June 2024 and has since built a lead of nearly $800 billion. This wasn't due to a fund manager's decision; it's the pure arithmetic of a market-cap-weighted index.
Nvidia's explosive revenue growth—85% year-over-year to $81.6 billion—forced the index to let its position swell. Meanwhile, the top five holdings (Nvidia, Apple, Microsoft, Amazon, Alphabet) now account for a staggering 25.22% of the entire fund.
How Did We Get Here?
- Nvidia's Revenue Explosion: The AI boom has created unprecedented demand for its chips.
- Apple's Stagnation: While still a giant, Apple's growth hasn't matched Nvidia's hyper-speed.
- The Index's Inaction: An S&P 500 fund doesn't pick winners; it simply reflects market values. As Nvidia grew, the fund's allocation grew with it.
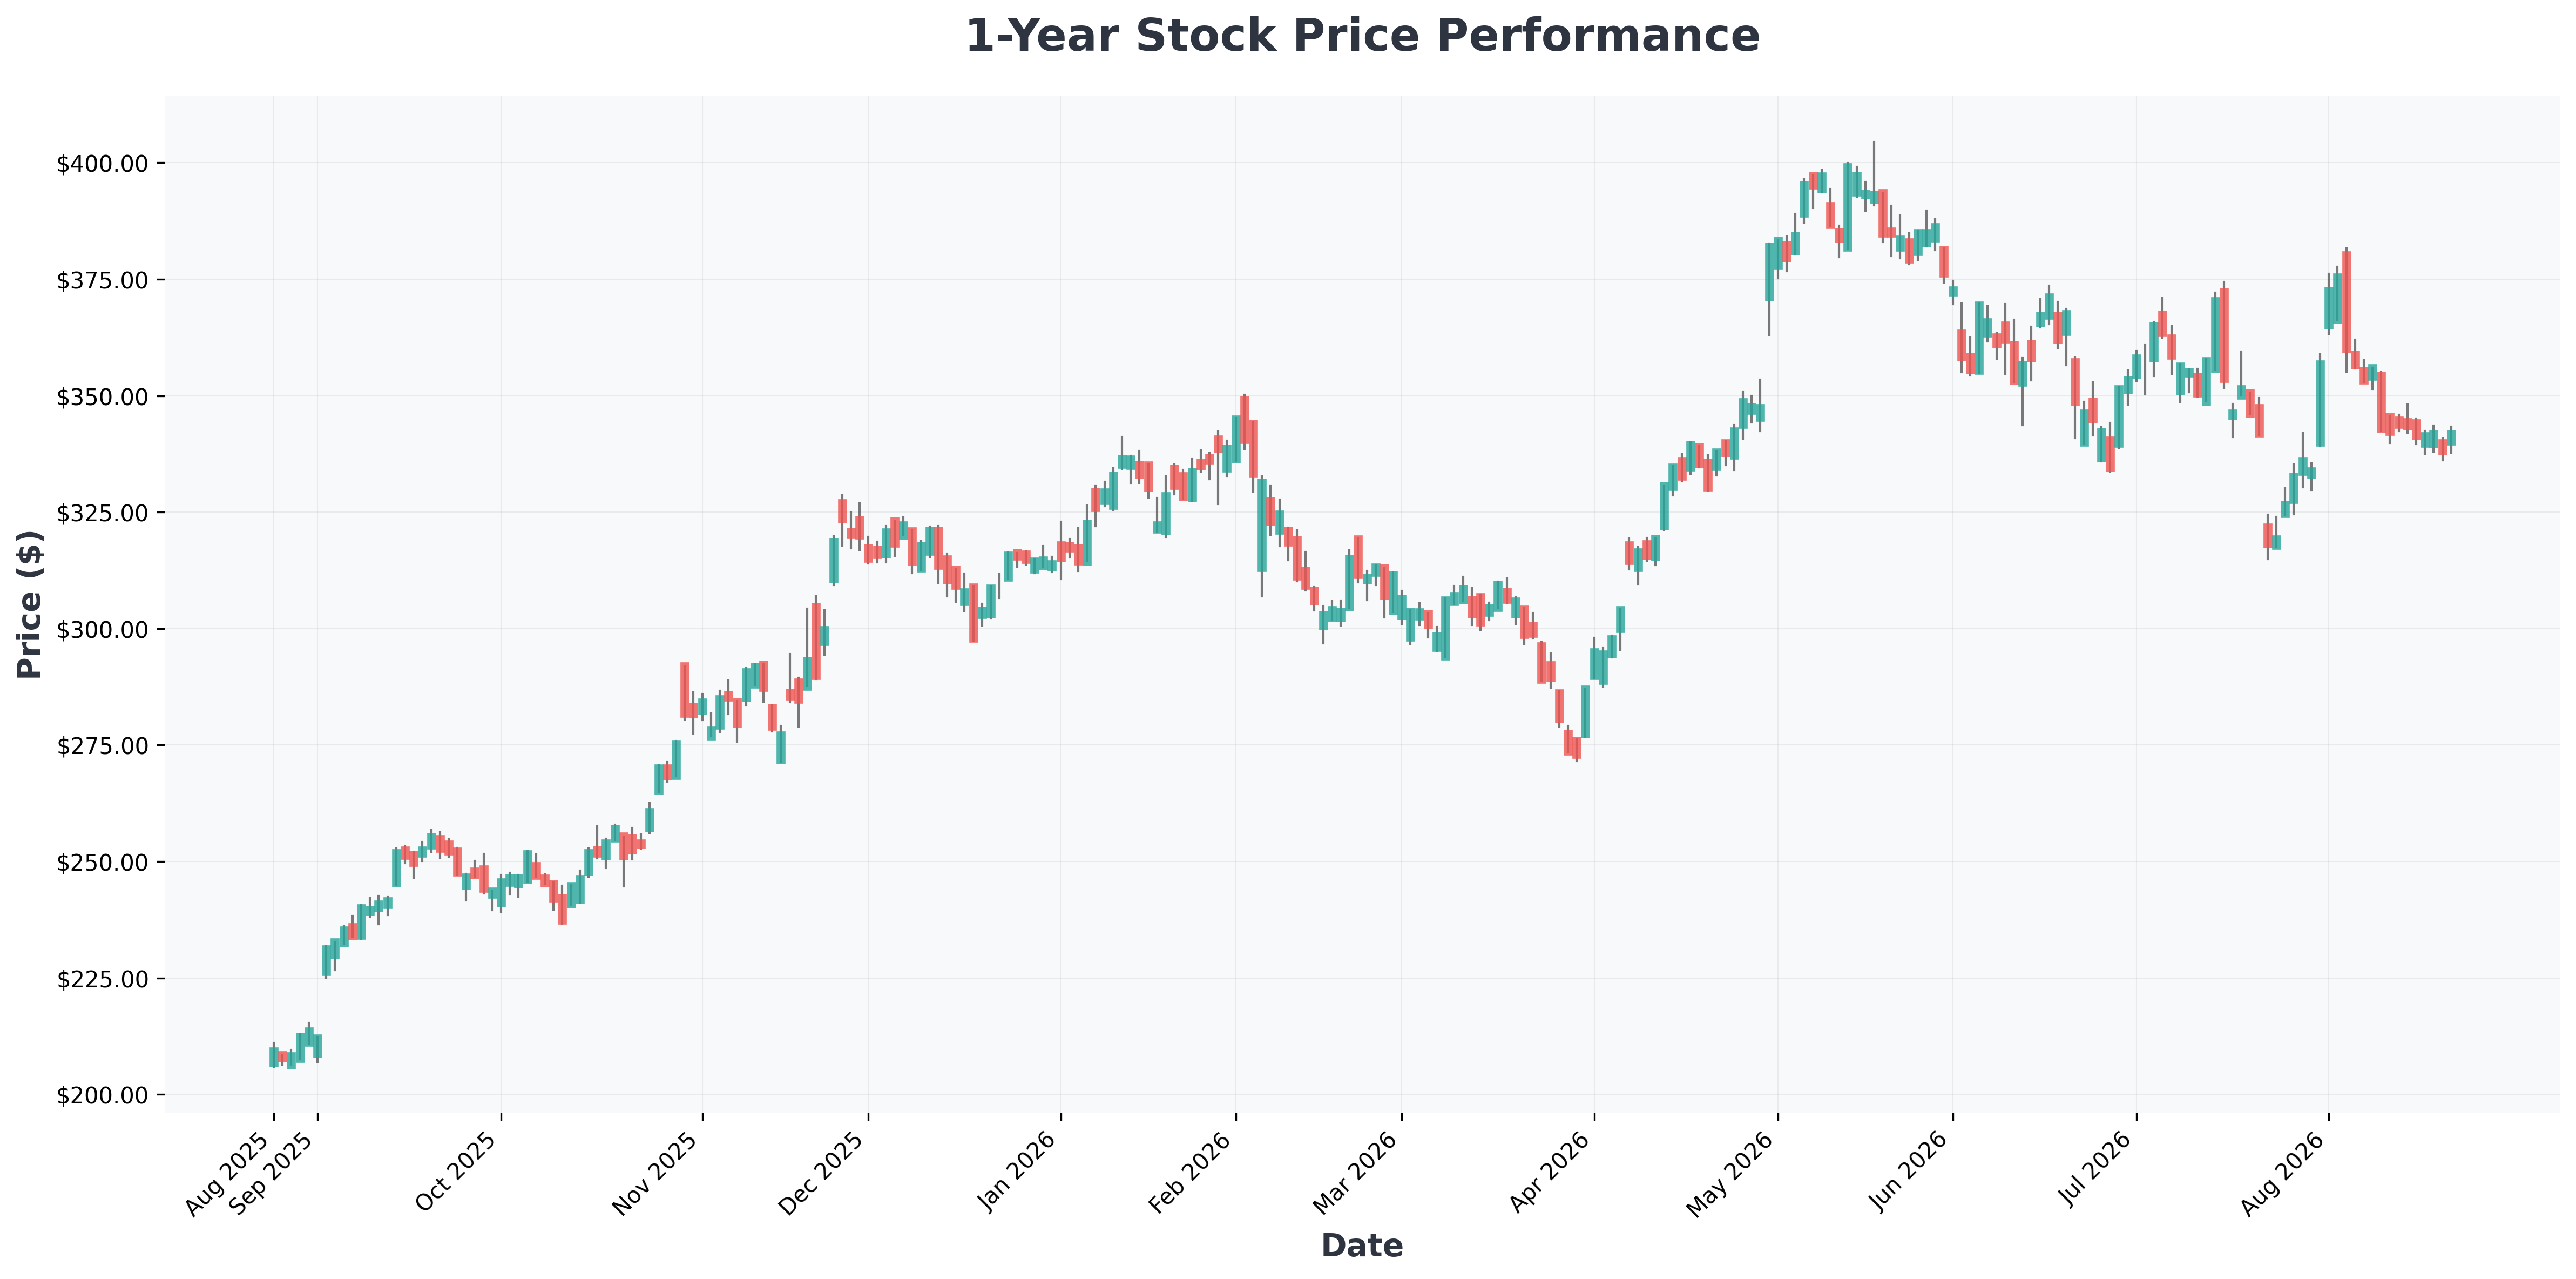
This shift in the index's DNA has split the investment community. Let's listen to both sides of the trade:
The Hidden Risk: A Quarter of Your Money on 5 Stocks 📊
Here’s the arithmetic that every index investor needs to understand: The top 10 positions in VOO now make up 36.33% of the fund's assets. The other 510 stocks share the remaining 63.67%.
This means your "diversified" index fund is now heavily dependent on the performance of a few AI-linked mega-caps.
| Metric | Vanguard S&P 500 ETF (VOO) |
|---|---|
| Top 5 Holdings Weight | 25.22% |
| Top 10 Holdings Weight | 36.33% |
| Nvidia's Weight | 7.50% |
| Apple's Weight | 6.58% |
| Remaining 510 Stocks Avg. Weight | ~0.12% each |
While this concentration has driven massive gains, it cuts both ways. A 20% decline in Nvidia alone would shave roughly 1.5% off the entire fund's value. The AI build-out is a phenomenal growth story, but it comes with a concentration risk that was unthinkable just a few years ago.
📊 In-Depth Fundamental Analysis
| Company | Share Price | P/E Ratio | P/B Ratio | ROE | Operating Margin (OPM) | Revenue Growth |
|---|---|---|---|---|---|---|
| NVDA (NVIDIA) | $215 | 32.88 | 26.61 | 114.29% | 65.60% | 85.20% |
| MSFT (Microsoft) | $483 | 26.95 | 8.11 | 34.04% | 45.11% | 17.70% |
| MU (Micron) | $967 | 21.83 | 10.84 | 66.64% | 80.37% | 345.70% |
| GOOGL (Alphabet) | $345 | 17.30 | 6.77 | 48.68% | 34.03% | 24.20% |
| AAPL (Apple) | $309 | 35.48 | 42.03 | 148.75% | 32.62% | 16.40% |
| GOOG (Alphabet) | $342 | 17.16 | 6.71 | 48.68% | 34.03% | 24.20% |
| AMZN (Amazon.com,) | $259 | 20.79 | 5.06 | 30.56% | 13.69% | 19.60% |
| AVGO (Broadcom) | $368 | 61.31 | 19.99 | 37.28% | 48.99% | 47.90% |
The Bottom Line: What Should Investors Do? 🎯
Best-Case Scenario: The AI boom continues, and Nvidia and its peers justify their valuations with sustained earnings growth. In this scenario, the S&P 500 continues to rally, and index investors reap the rewards.
Worst-Case Scenario: An AI bubble bursts, or growth slows dramatically. Given the heavy concentration, a correction in tech would hit the S&P 500 far harder than in previous decades. The index's self-correcting mechanism would eventually thin these positions out, but it would be a painful process.
My Take: An S&P 500 index fund remains the simplest, most effective way to own the U.S. market. But you must understand what you're buying. Today, buying the index means making a significant bet on AI. Don't be lulled into a false sense of security by the word "diversified." Know the weights, know the risks, and make sure this concentration aligns with your personal risk tolerance.