The Quiet Giant That Outran Tech 📈
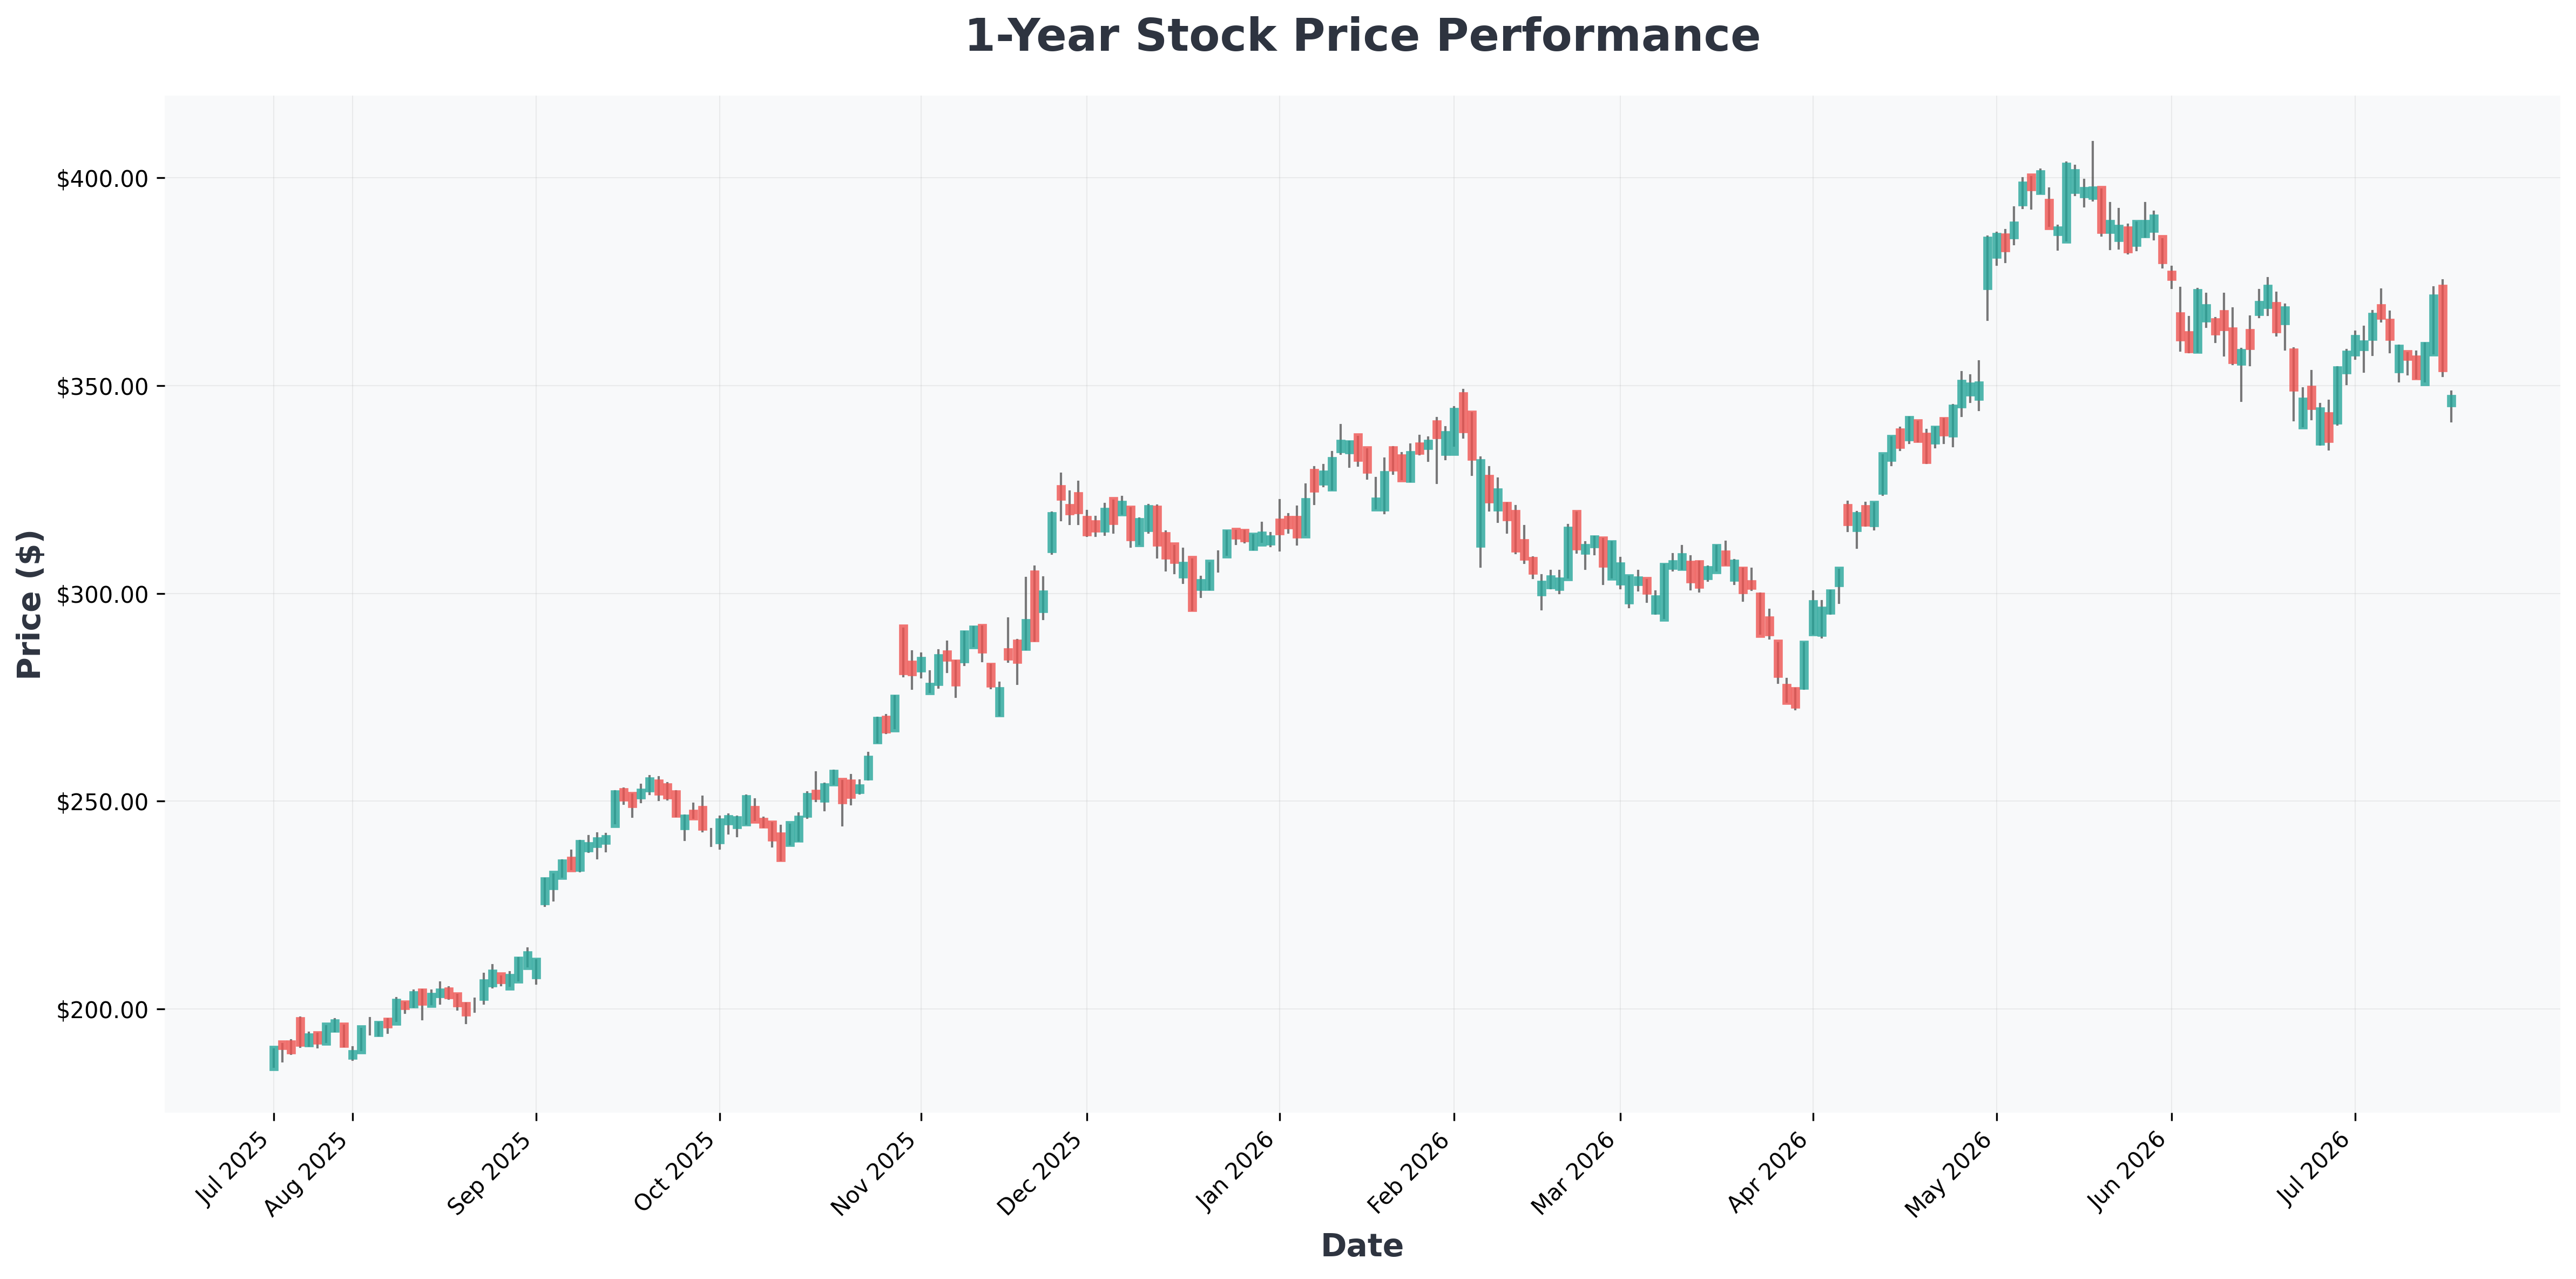
The Schwab U.S. Dividend Equity ETF (SCHD) has done something unusual this year. It’s up roughly 20% in 2026, outpacing the S&P 500 (11%) and the tech-heavy Nasdaq-100 (17%). For a fund often dismissed as a boring income vehicle, that’s a statement.
With a 3.2% dividend yield, a minuscule 0.06% expense ratio, and over $100 billion in AUM, SCHD is proving that quality and patience can still beat hype. But how exactly did a basket of old-economy dividend payers outperform the AI-fueled growth trade?
The Engine: A Rules-Based Quality Filter 🏭
SCHD tracks the Dow Jones U.S. Dividend 100 Index, which is far from a simple yield chase. The index applies a rigorous four-factor screen:
- Free Cash Flow to Total Debt (avoiding leverage traps)
- Return on Equity (profitability)
- Dividend Yield (income)
- 5-Year Dividend Growth Rate (sustainability)
Only companies with 10+ consecutive years of dividend payments are eligible. REITs and MLPs are excluded. The result is a portfolio that naturally filters out speculative growth stocks and yield traps. Top holdings include UnitedHealth Group, Home Depot, Abbott Laboratories, Coca-Cola, and Chevron — steady compounders, not flashy story stocks.
This year’s performance has sparked a lively debate. Is SCHD’s outperformance a signal of a lasting regime change, or just a temporary rotation?
Why 2026 Became SCHD’s Year 🔄
The fund’s exclusion of high-flying AI names (Nvidia, Microsoft, Alphabet) was a drag during the boom. In 2026, it became a superpower. A massive rotation out of expensive tech and into defensive, value-oriented sectors like healthcare, consumer staples, and energy has been the dominant theme. SCHD was already heavily weighted in all three.
| Metric | SCHD | S&P 500 | Nasdaq-100 |
|---|---|---|---|
| YTD Return (2026) | ~20% | ~11% | ~17% |
| Dividend Yield | 3.2% | 1.3% | 0.6% |
| P/E Ratio | ~17x | ~22x | ~28x |
| Top Sector | Healthcare (21%) | Tech (30%) | Tech (60%) |
Investors are paying 17x earnings for SCHD’s holdings versus the mid-20s for the broader market. You’re getting a cheaper, more resilient basket of businesses, and getting paid more to hold them.
📊 In-Depth Fundamental Analysis
| Company | Share Price | P/E Ratio | P/B Ratio | ROE | Operating Margin (OPM) | Revenue Growth |
|---|---|---|---|---|---|---|
| ABT (Abbott) | $101 | 28.20 | 3.35 | 0.00% | 14.15% | 13.00% |
| CVX (Chevron) | $187 | 32.70 | 2.02 | 6.64% | 7.31% | 2.30% |
| GOOG (Alphabet) | $346 | 26.38 | 8.76 | 38.88% | 36.12% | 21.80% |
| GOOGL (Alphabet) | $347 | 26.45 | 8.78 | 38.88% | 36.12% | 21.80% |
| HD (Home) | $339 | 24.10 | 24.35 | 128.38% | 11.93% | 4.80% |
| KO (Coca-Cola) | $82 | 25.65 | 10.44 | 43.37% | 35.05% | 12.10% |
| MSFT (Microsoft) | $394 | 23.47 | 7.06 | 34.01% | 46.33% | 18.30% |
| NVDA (NVIDIA) | $203 | 31.06 | 25.13 | 114.29% | 65.60% | 85.20% |
| PG (Procter) | $150 | 21.93 | 6.50 | 31.11% | 23.05% | 7.40% |
| UNH (UnitedHealth) | $426 | 32.06 | 3.95 | 14.15% | 7.13% | 0.40% |

The Verdict: Buy the Anchor, Not the Story ⚓
Over the long term, a dividend screen probably won’t beat the Nasdaq-100 every year — that’s not its job. Its job is to deliver a growing income stream from durable businesses with less volatility. SCHD has compounded at roughly 13% annually since inception.
Best-Case Scenario: The rotation continues. Value and income stocks keep rallying as AI valuations compress. SCHD delivers 15%+ returns with a growing 3.5% yield.
Worst-Case Scenario: AI stocks reassert dominance in H2 2026. SCHD underperforms the Nasdaq but still delivers positive total returns and consistent dividends.
For investors seeking a reliable income anchor that doesn’t depend on the AI trade staying hot, SCHD remains a solid buy — even near its all-time high.