The Bull Market Is Aging — and the Warning Lights Are On 🚨
Roughly two weeks ago, Wall Street quietly marked the fourth anniversary of the current bull market. Since the 2022 bear market bottomed out, the S&P 500 and the tech-heavy Nasdaq Composite have more than doubled, while the Dow Jones Industrial Average has rallied 84%. 📈
Credit where it's due: record buybacks, resilient earnings, and — above all — the AI infrastructure build-out have powered this run. The capital flooding into AI data centers is genuinely reshaping long-term growth projections.
But bull markets don't last forever. And right now, four indicators with a historically flawless track record are all sounding the alarm at the same time. That's not a coincidence — it's a pattern. 📌

Indicator #1: The Second-Priciest Market in History 💰
Valuation is subjective — there's no one-size-fits-all way to price a market. That's exactly why the Shiller P/E Ratio (CAPE) matters: it strips out emotion and delivers apples-to-apples comparisons going back to 1871.
Over 156 years, the CAPE has averaged 17.44. As of Oct. 21, it topped 41 — the second-highest reading ever recorded. Since 1871, the CAPE has exceeded 30 during a continuous bull market only six times, including today. The previous five? All followed by declines of 20% to 89% in major indexes. ⚠️
Indicator #2: Margin Debt Has Gone Parabolic 🔥
FINRA's monthly margin debt data is a crude but powerful gauge of risk appetite. Between April 2025 and June 2026, outstanding margin debt skyrocketed 77% to an all-time high of $1.502 trillion.
Since 1998, there have been four instances where margin debt surged at least 65% in a short window. The prior three peaked as the dot-com bubble burst, as the financial crisis took shape, and three months before the 2022 bear market. The S&P 500 shed 49%, 57%, and 25% respectively. 🐻
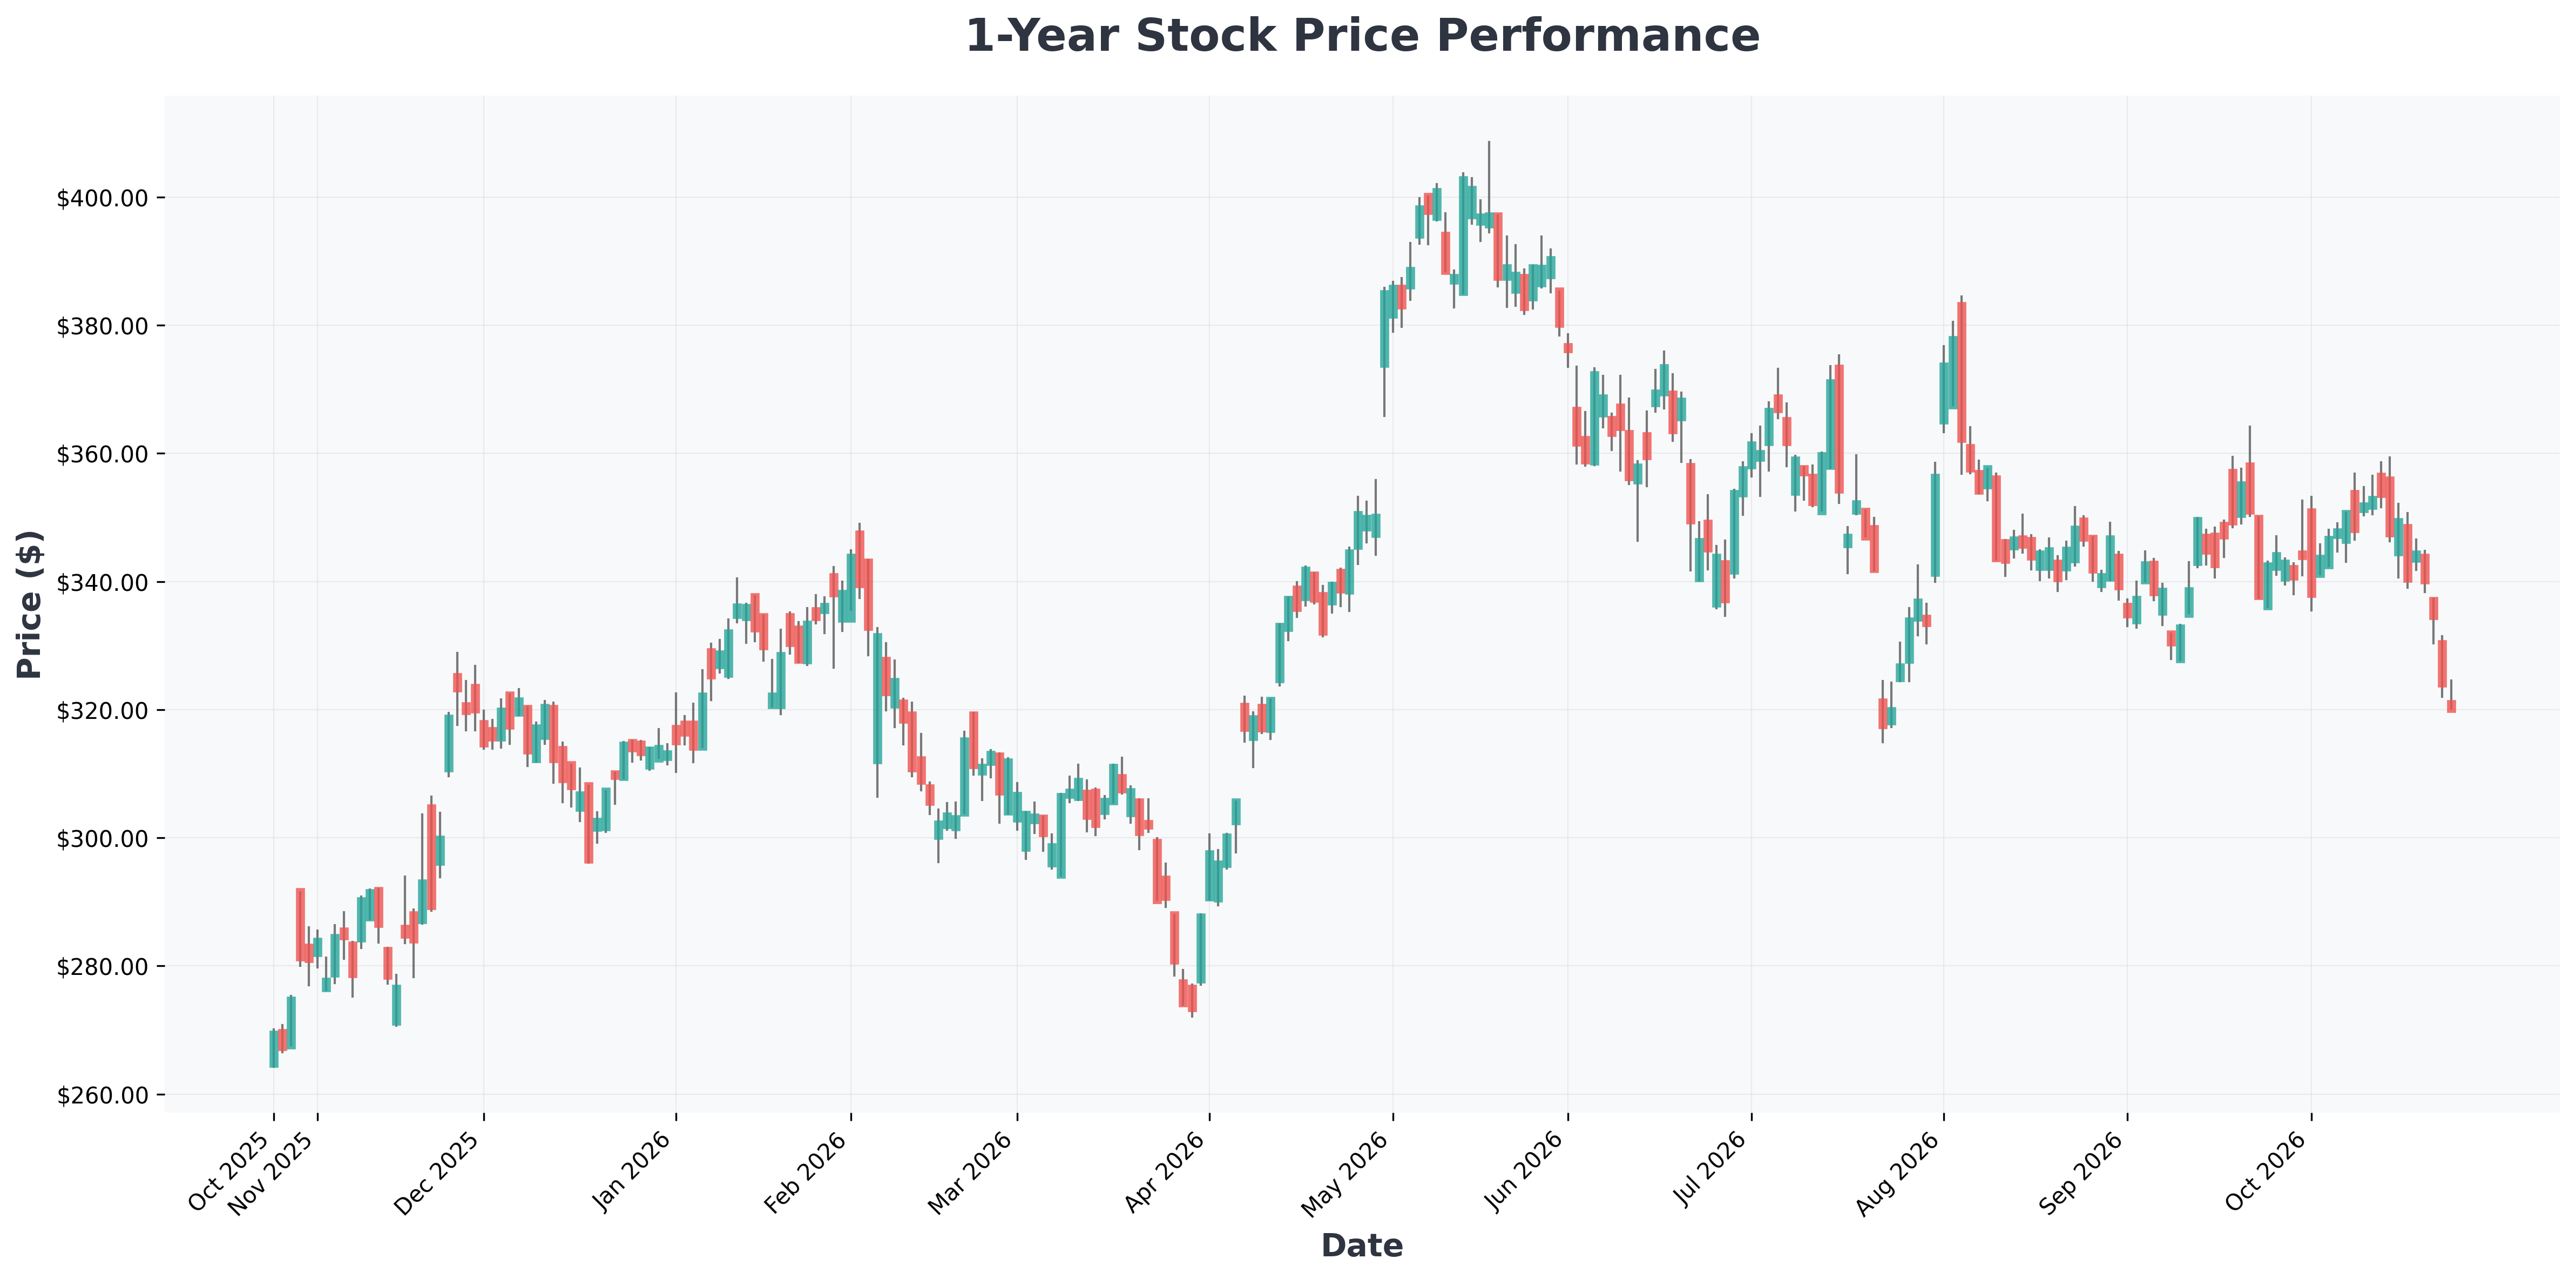
Wall Street is split on whether these signals are a genuine warning or just noise in an AI-driven supercycle. Here's how both sides are framing it.

Indicator #3: The Next-Big-Thing Bubble Pattern 🫧
History is unambiguous: game-changing tech and bubble-bursting events travel together. Since the mid-1990s we've watched bubbles pop in the internet, genome decoding, nanotechnology, 3D printing, blockchain, and the metaverse.
The twist with AI? Adoption isn't the problem — spending is incredibly strong. The problem is optimization lag. It took years after the dot-com crash for companies to actually figure out how to monetize the internet. Expect a similar timeline for AI. ⏳
Indicator #4: S&P 500 Concentration at an Extreme 📊
According to Bespoke Investment Group, the 15 largest S&P 500 stocks now account for nearly 47% of the index — roughly 20 percentage points above the pre-dot-com peak.
Bank of America's Global Investment Strategy research shows that over the last 190 years, extreme concentration events — railroads in 1900, the Nifty Fifty in the early 1970s, tech/telecom in 2000 — were consistently followed by crashes or steep bear declines.
The Four Alarms at a Glance
| Indicator | Current Reading | Historical Precedent |
|---|---|---|
| Shiller CAPE | ~41 (2nd highest ever) | 5/5 prior cases → -20% to -89% |
| Margin Debt | +77% since Apr 2025, $1.502T ATH | 3/3 prior surges → major bear markets |
| AI Bubble Dynamics | Adoption strong, optimization lagging | Internet, blockchain, metaverse precedents |
| Top-15 Concentration | ~47% of S&P 500 | 1900, 1970s, 2000 → crashes followed |
📊 In-Depth Fundamental Analysis
| Company | Share Price | P/E Ratio | P/B Ratio | ROE | Operating Margin (OPM) | Revenue Growth |
|---|---|---|---|---|---|---|
| AAPL (Apple) | $348 | 39.88 | 47.25 | 148.75% | 32.62% | 16.40% |
| AVGO (Broadcom) | $322 | 42.95 | 15.40 | 44.25% | 54.31% | 85.50% |
| BAC (Bank) | $51 | 12.07 | 1.29 | 10.73% | 31.26% | 7.10% |
| GOOG (Alphabet) | $317 | 15.92 | 6.23 | 48.68% | 34.03% | 24.20% |
| GOOGL (Alphabet) | $320 | 16.07 | 6.29 | 48.68% | 34.03% | 24.20% |
| META (Meta) | $643 | 21.92 | 6.03 | 32.26% | 35.41% | 26.10% |
| MSFT (Microsoft) | $525 | 29.22 | 8.81 | 34.04% | 45.11% | 17.70% |
| NVDA (NVIDIA) | $211 | 26.67 | 22.25 | 117.21% | 66.24% | 105.90% |

Scenario & Conclusion 🎯
Best Case (Soft Landing): AI monetization accelerates faster than expected, earnings catch up to valuations, margin debt unwinds gradually, and concentration dilutes as breadth improves. The bull market extends — but with thinner margins for error.
Worst Case (Historical Rhyme): CAPE mean-reverts, margin calls trigger forced selling, the AI trade unwinds, and concentration collapses. History suggests a 20%-50% drawdown is well within the range of prior precedents.
The Takeaway: None of these four indicators can time the market. But when all four flash together, the risk/reward skews decisively toward caution. Investors should note that premium valuations, parabolic leverage, and extreme concentration are not tolerated for long — historically, they've always resolved. The only question is how. 🐂🐻
Every market cycle carries risk. Position sizing and diversification remain the most reliable defenses against the unknown.