The Perfect Storm Hits Wall Street 📌
Today's market action is a textbook example of how multiple macro risks can converge to create a violent selloff. The Dow Jones Industrial Average is down over 700 points (-1.7%), the S&P 500 has shed 1%, and the Nasdaq Composite is off by 1.3%. But the headline numbers don't tell the full story.
The three triggers hitting simultaneously:
- Geopolitical shock: Oil prices surged 6%+ after President Trump threatened military action against Iran
- Fed uncertainty: Traders are pricing in a 70% chance of rates staying at 3.5%-3.75%, but the press conference is the real wildcard
- Tech valuation reset: Semiconductor stocks are getting hammered as richly valued growth names get de-risked
What makes this selloff particularly concerning is the breadth of the decline. Caterpillar (CAT) is down 7.3%, Goldman Sachs (GS) fell 4.6%, and even companies that beat earnings like Sherwin-Williams (SHW) are getting sold off. When good news gets punished, it's a red flag for the broader market.

The Oil-Geopolitics Feedback Loop 🔥
The immediate catalyst is clear: President Trump's threat to give Iran 'a beating' has completely erased the diplomatic progress made last Friday. The overnight missile attack on American forces has reignited fears of a broader Middle East conflict.
Why this matters for your portfolio:
- Every company depends on energy costs. Higher oil = higher input costs for retailers, manufacturers, and tech companies
- The 6% spike in crude is not just a one-day event—it signals that the geopolitical risk premium is being repriced
- Historically, sustained oil shocks above $100/barrel have preceded recessions (see 2008, 2014, 2022)
From a technical perspective, the S&P 500 is now testing its 50-day moving average, a key support level. If it breaks below this level with today's volume, we could see a retest of the June lows around 5,400.
This is where the market divides sharply. Here's how the bulls and bears are framing today's selloff:
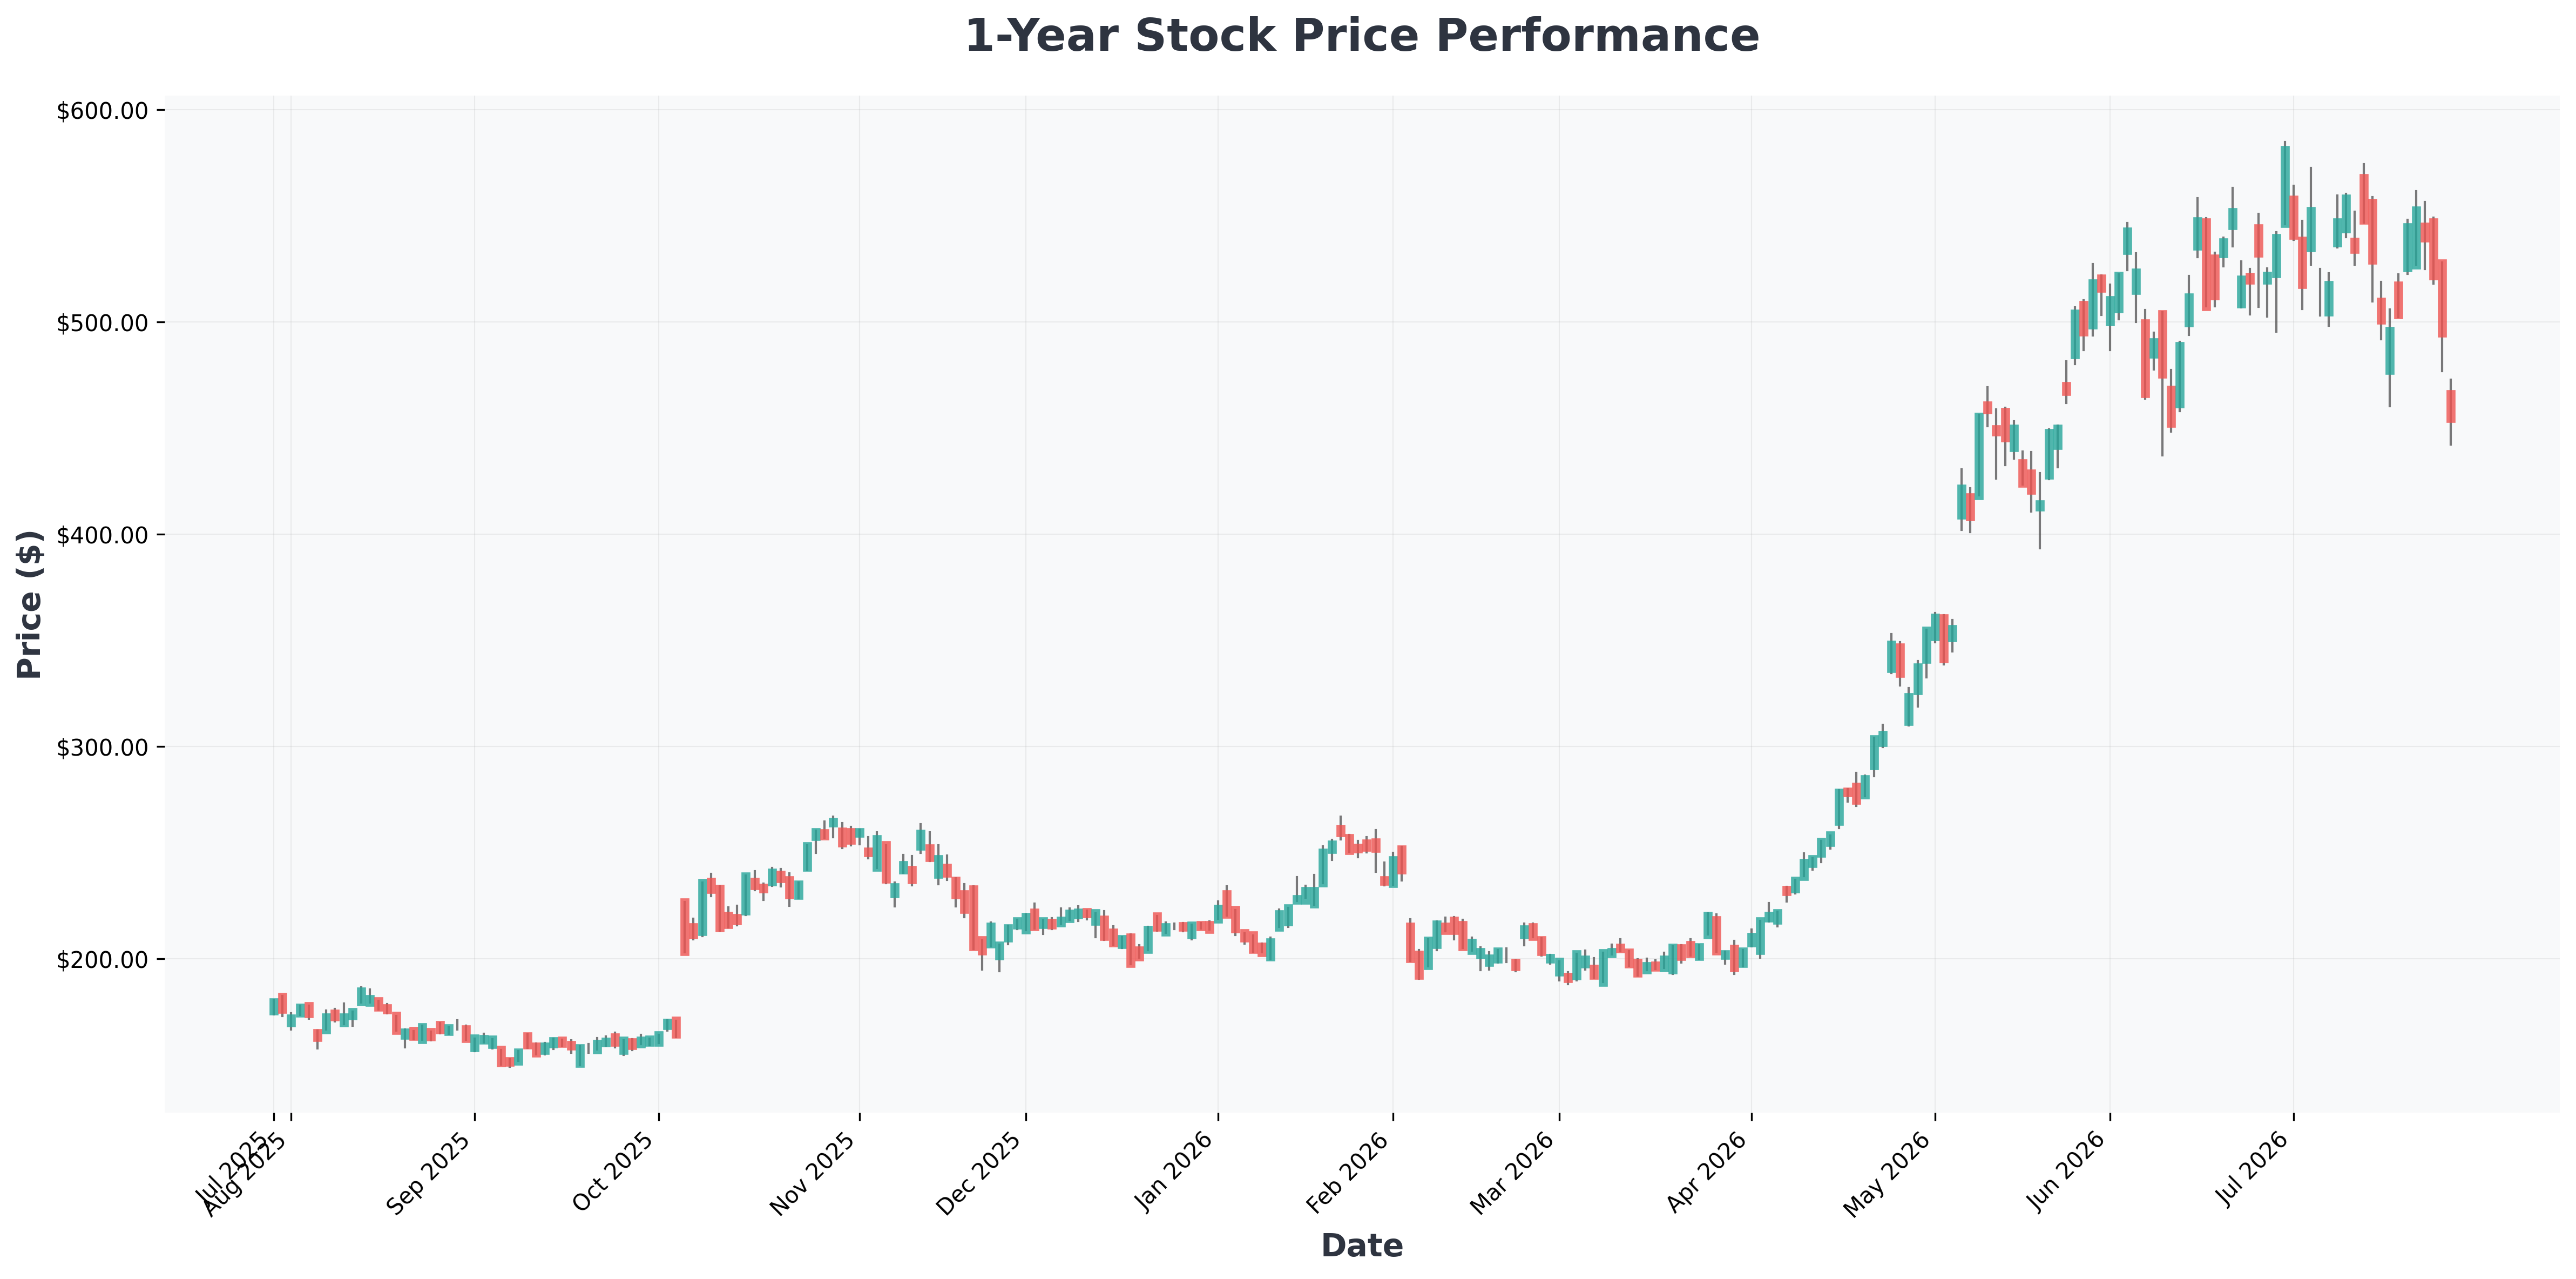

Semiconductor Carnage: The Canary in the Coal Mine 💾
The iShares Semiconductor ETF (SOXX) plunged 4.4%, extending its weekly decline to a staggering 10%. This is not just profit-taking—it's a structural rotation out of the most expensive part of the market.
| Ticker | Company | Today's Drop | 52-Week Context |
|---|---|---|---|
| MU | Micron Technology | -5.7% | Down 15% from highs |
| AMD | Advanced Micro Devices | -5.8% | Testing key support |
| NVDA | NVIDIA | -3.2% | Still up 120% YoY |
| INTC | Intel | -2.1% | Near 52-week lows |
The selling in semiconductors is particularly telling because this sector has been the leader of the bull market. When leaders break down, it often signals that the broader market is due for a correction. The SOXX breaking below its 100-day moving average is a technical warning sign that institutional investors are taking seriously.
📊 In-Depth Fundamental Analysis
| Company | Share Price | P/E Ratio | P/B Ratio | ROE | Operating Margin (OPM) | Revenue Growth |
|---|---|---|---|---|---|---|
| AMD (Advanced) | $430 | 143.19 | 10.86 | 8.06% | 14.40% | 37.80% |
| BA (Boeing) | $214 | 84.59 | 27.74 | 169.95% | 1.71% | 14.00% |
| CAT (Caterpillar,) | $783 | 38.94 | 19.32 | 51.33% | 18.18% | 22.20% |
| GS (Goldman) | $981 | 15.14 | 2.68 | 16.95% | 42.32% | 42.50% |
| META (Meta) | $586 | 21.32 | 6.10 | 32.93% | 40.62% | 33.10% |
| MSFT (Microsoft) | $391 | 23.25 | 7.00 | 34.01% | 46.33% | 18.30% |
| MU (Micron) | $739 | 16.71 | 8.28 | 66.64% | 80.37% | 345.70% |
| SHW (Sherwin-Williams) | $344 | 33.00 | 18.42 | 65.12% | 18.13% | 7.50% |

Scenarios & Conclusion: What Comes Next? 🎯
Best-Case Scenario (40% Probability)
- The Fed delivers a dovish hold with signals that rate cuts are coming in Q4
- Oil stabilizes below $85/barrel as diplomatic channels reopen
- Magnificent 7 earnings this week show strong AI spending, calming tech investors
- S&P 500 target: Rebound to 5,800 within 2 weeks
Worst-Case Scenario (30% Probability)
- The Fed signals 'higher for longer' due to oil-driven inflation concerns
- Iran conflict escalates, pushing oil above $95
- Tech earnings disappoint on data center spending guidance
- S&P 500 target: Further decline to 5,200 (10% correction from highs)
Base Case (30% Probability)
- Mixed Fed commentary, oil stays elevated but doesn't spike further
- Markets remain volatile but find a floor after earnings season
- S&P 500 target: Range-bound between 5,400-5,700
The bottom line: Today's selloff is a reminder that geopolitical risk + monetary policy uncertainty + elevated valuations is a dangerous cocktail. Long-term investors should use this volatility to rebalance, not panic. The best opportunities often emerge when the market is pricing in maximum uncertainty.